

not logged in | [Login]
![]()
Scenario Toolchain Steps
Previous step
Next step
This is the second step of the analysis at local and municipal level.
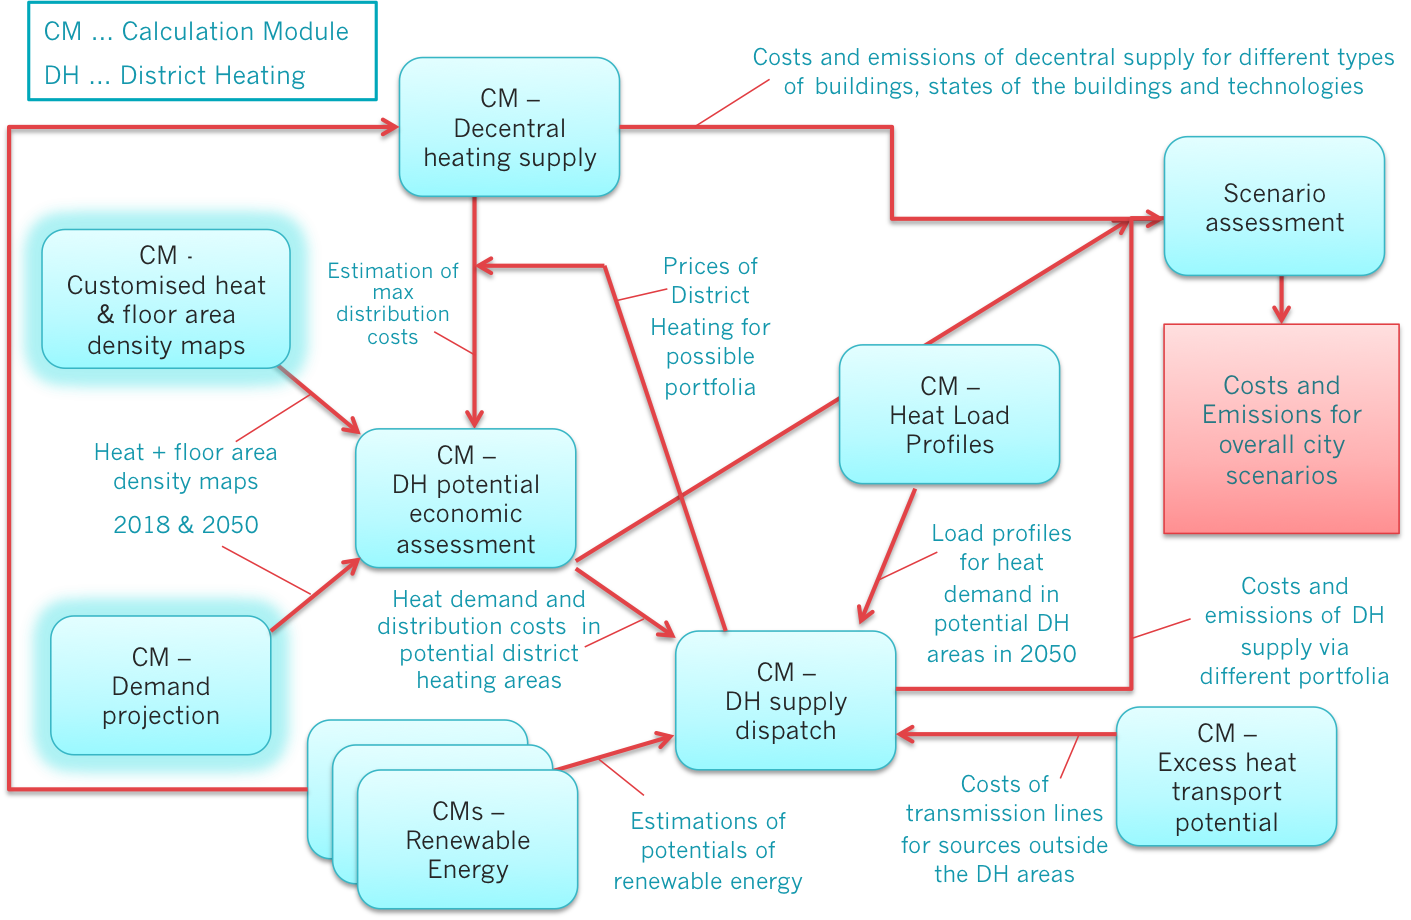
Figure: The steps to calculate the future heat demand and gross floor area density maps are highlighted in the Toolchain above
The second step in the analysis is to generate future heat demand and gross floor area density maps for your city/region of interest. You can use data developed in the course of the Hotmaps project for all EU-28 countries (Hotmaps default data, available in the Hotmaps database), or you can use other heat demand density maps for your region of interest.
The developed heat demand and gross floor area density maps are further used in the subsequent steps in other Calculation Modules (CMs).
Marcus Hummel, Giulia Conforto, in Hotmaps-Wiki, Guidelines for using the Hotmaps toolbox for analyses at local level (August 2020)
This page was written by Marcus Hummel and Giulia Conforto (e-think).
☑ This page was reviewed by Mostafa Fallahnejad (EEG - TU Wien).
Copyright © 2016-2020: Marcus Hummel, Giulia Conforto
Creative Commons Attribution 4.0 International License
This work is licensed under a Creative Commons CC BY 4.0 International License.
SPDX-License-Identifier: CC-BY-4.0
License-Text: https://spdx.org/licenses/CC-BY-4.0.html
We would like to convey our deepest appreciation to the Horizon 2020 Hotmaps Project (Grant Agreement number 723677), which provided the funding to carry out the present investigation.
View in another language:
* machine translated