

not logged in | [Login]
![]()
Scenario Toolchain Steps
Previous step
This is the last step of the analysis at local and municipal level.
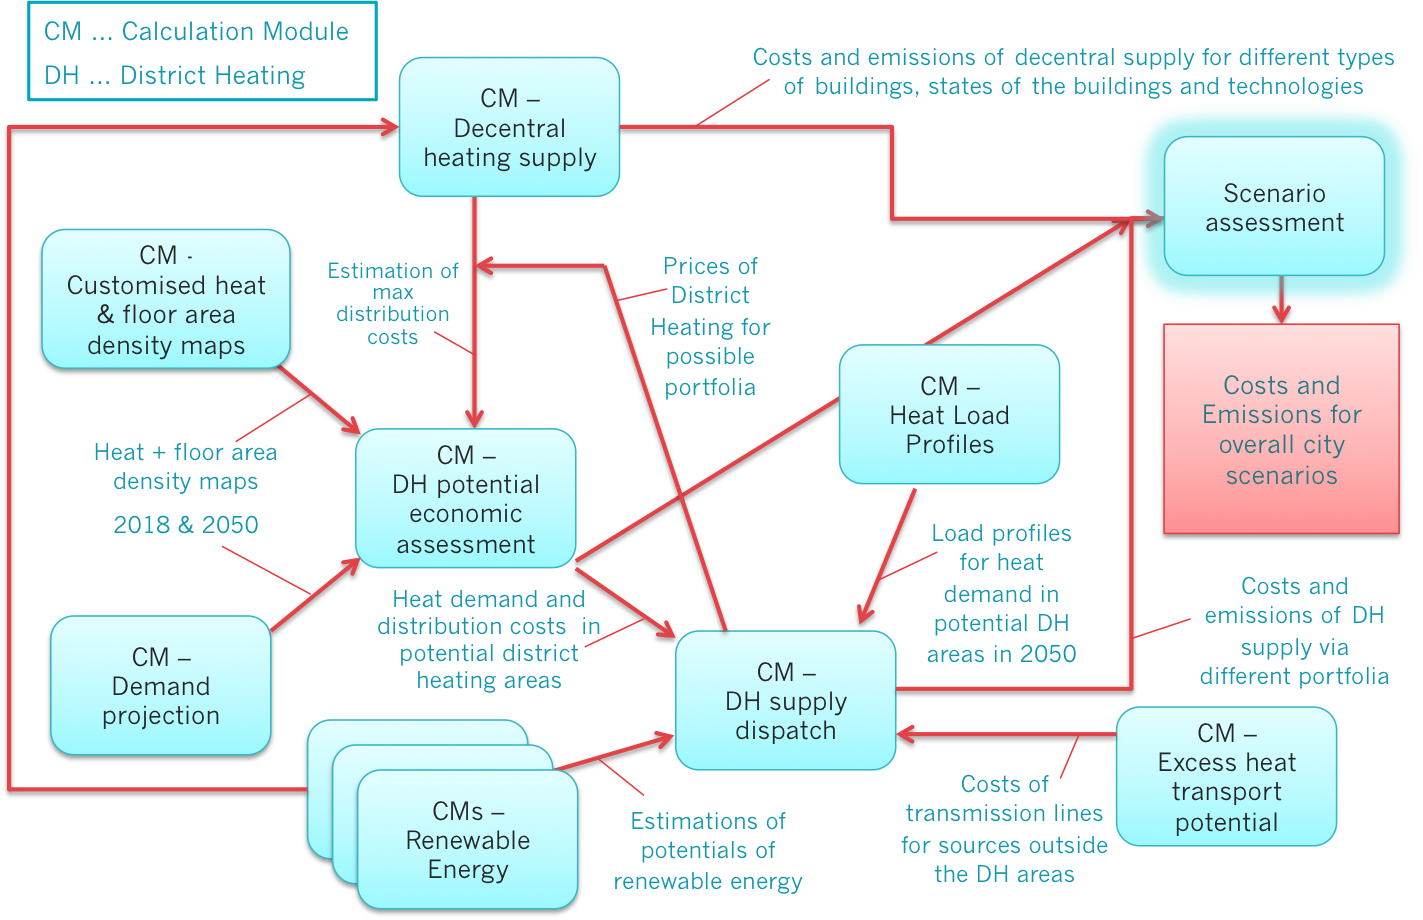
Figure: The steps to assess different scenarios for the entire heat demand and supply are highlighted in the Toolchain above.
The final step in the analysis is the comparison of the results for the different scenarios and sensitivities. For this, all results calculated in the previous steps are collected both from the calculations of district heating as well as from the calculations of decentral supply and compared against each other for main indicators. The CM - Scenario Assessment allows to easily combine and compare all relevant data, its approach is illustrated in the following figure.
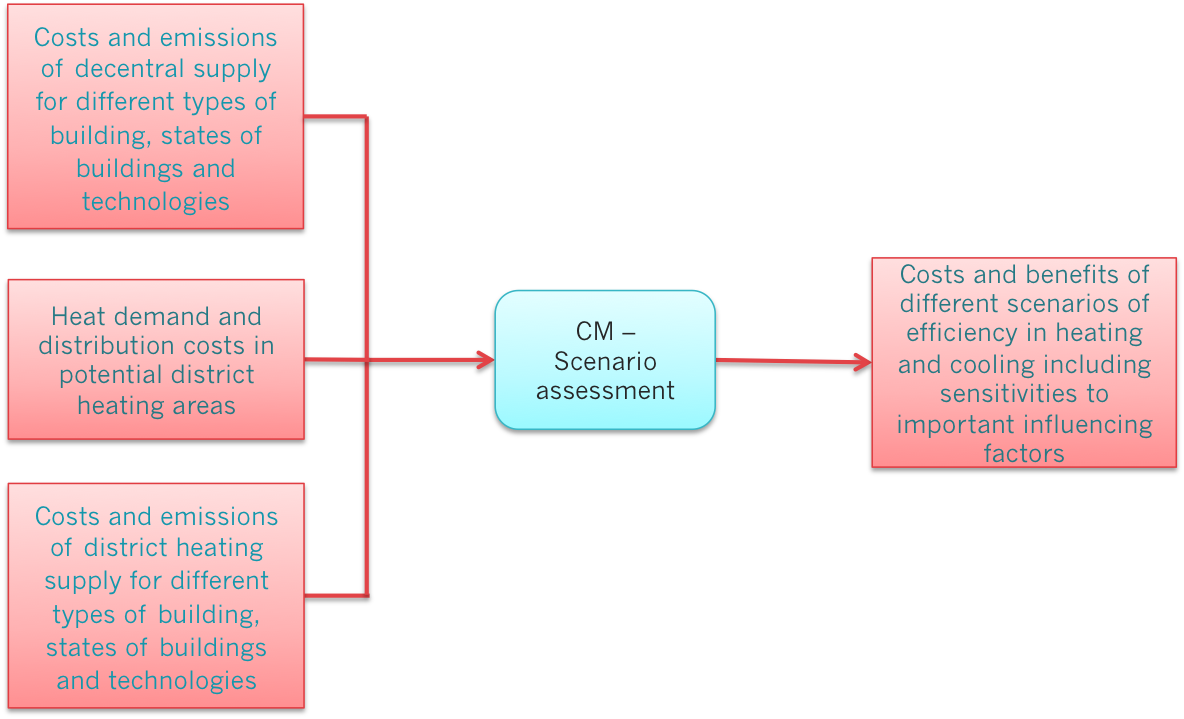
Figure: Comparison of results for different scenarios
Marcus Hummel, Giulia Conforto, in Hotmaps-Wiki, Guidelines for using the Hotmaps toolbox for analyses at local level (August 2020)
This page was written by Marcus Hummel and Giulia Conforto (e-think).
☑ This page was reviewed by Mostafa Fallahnejad (EEG - TU Wien).
Copyright © 2016-2020: Marcus Hummel, Giulia Conforto
Creative Commons Attribution 4.0 International License
This work is licensed under a Creative Commons CC BY 4.0 International License.
SPDX-License-Identifier: CC-BY-4.0
License-Text: https://spdx.org/licenses/CC-BY-4.0.html
We would like to convey our deepest appreciation to the Horizon 2020 Hotmaps Project (Grant Agreement number 723677), which provided the funding to carry out the present investigation.
View in another language:
Bulgarian* Czech* Danish* German* Greek* Spanish* Estonian* Finnish* French* Irish* Croatian* Hungarian* Italian* Lithuanian* Latvian* Maltese* Dutch* Polish* Portuguese (Portugal, Brazil)* Romanian* Slovak* Slovenian* Swedish*
* machine translated