

not logged in | [Login]
![]()
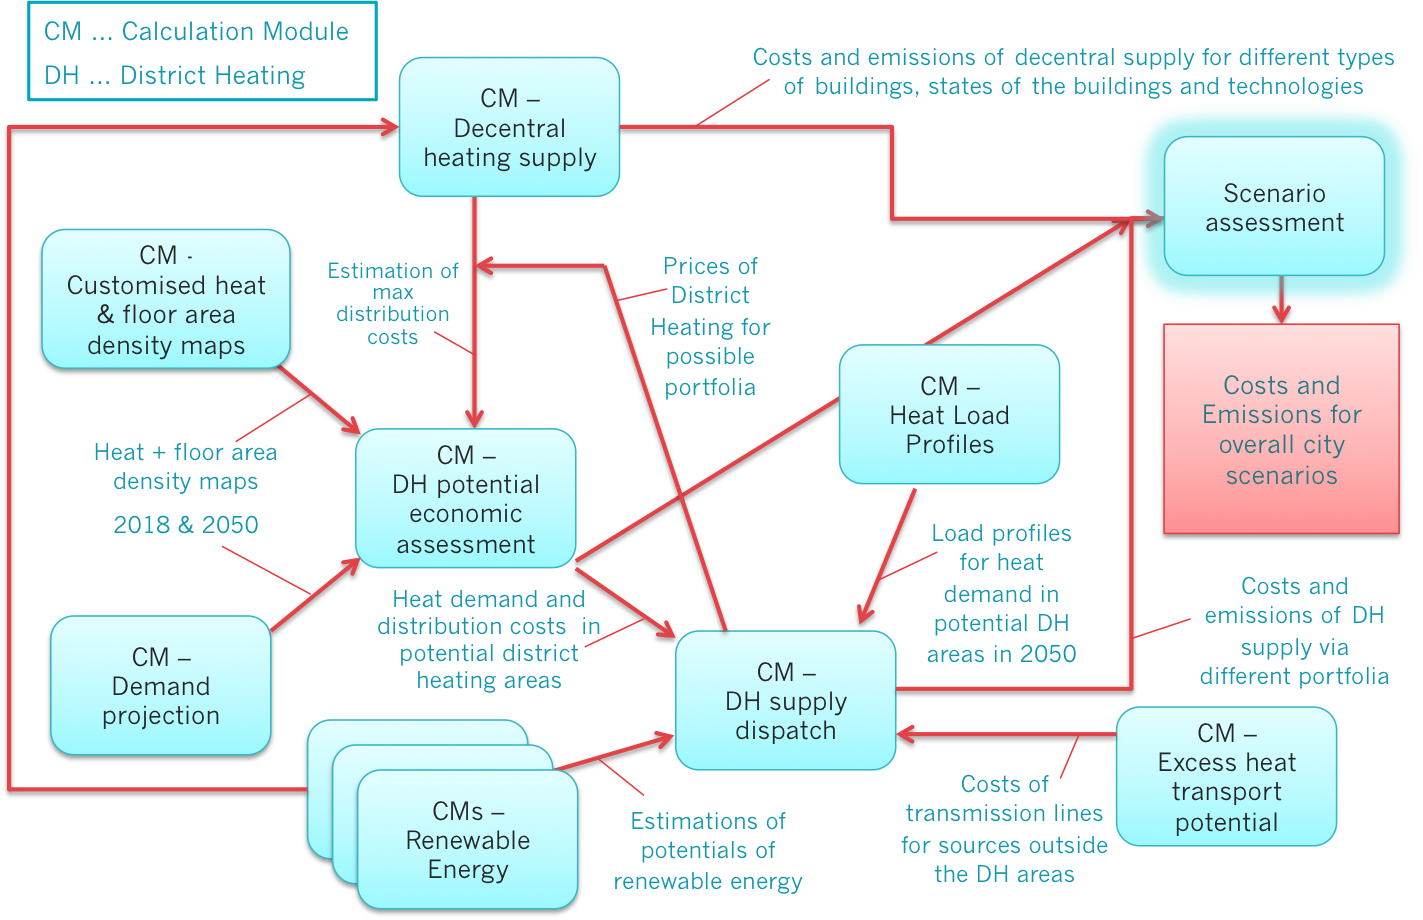 The steps to assess different scenarios for the entire heat demand and supply are highlighted above.
The final step in the analysis is the comparison of the results for the different scenarios and sensitivities. For this, all results calculated in the previous steps are collected both from the calculations of district heating as well as from the calculations of decentral supply and compared against each other for main indicators. This can be done in the CM - Scenario Assessment. The following figure shows this approach.
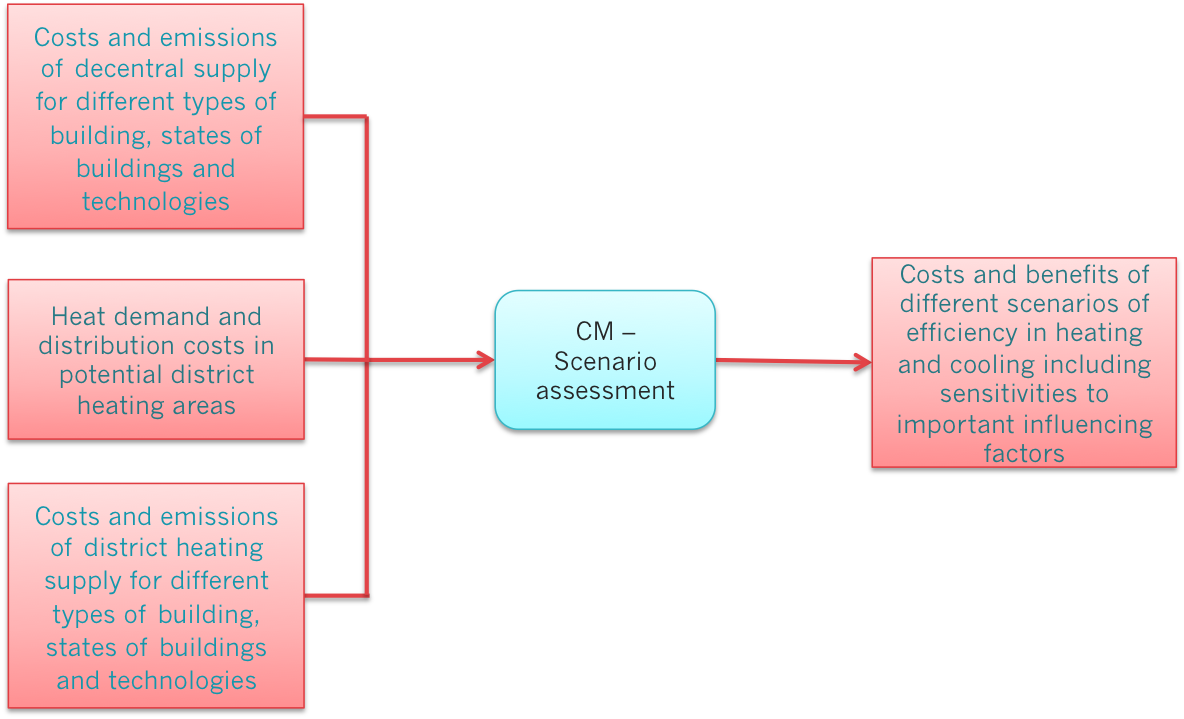 Comparison of results for different scenarios