Step 2: Calculation of future heat demand and gross floor area density maps

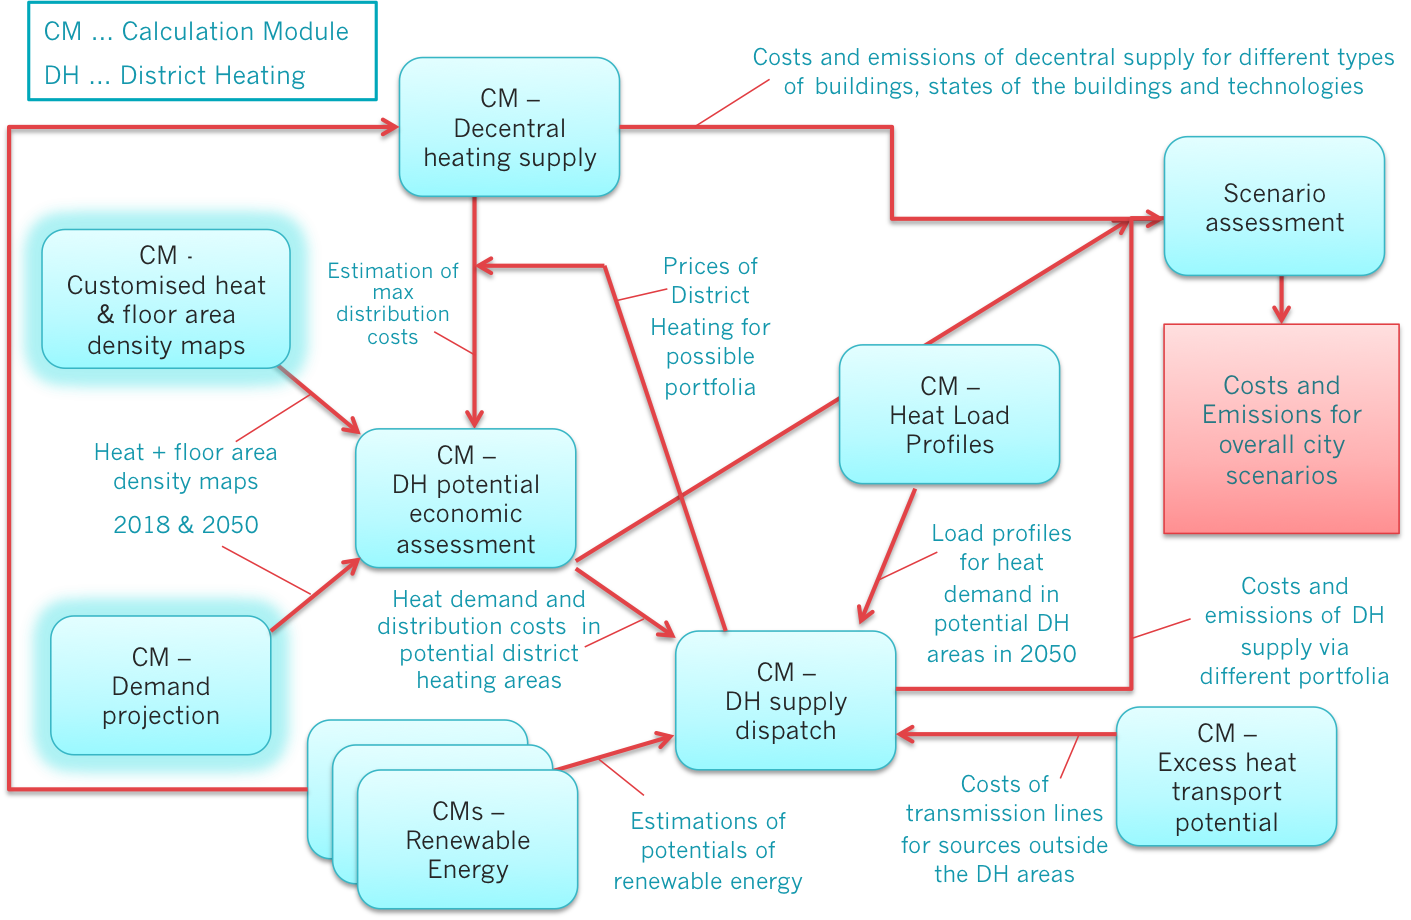
The steps to calculate the future heat demand and gross floor area density maps are highlighted above

The first step in the analysis is to generate future heat demand and floor area density maps for your city/region of interest. You can use data developed in the course of the Hotmaps project for all EU-28 countries (Hotmaps default data, available in the Hotmaps database), or you can use other heat demand density maps for your region of interest.

  • Use heat demand and floor area density maps developed in the course of the Hotmaps project - default data on heat demand density from the Hotmaps database:
    • For all EU 28 Member States (MS) heat demand density maps reflecting the heat demand from space heating and hot water generation in buildings have been developed. They are available as the total demand in residential and non-residential buildings, but also split between residential and non-residential buildings. All maps are all available at hectare level, i.e. with a resolution of 100x100m. The heat demand density maps can be accessed in the layers section of the Hotmaps database and more information on how to select the region of your interest can be found here.
    • It is possible to adapt the heat demand density maps according to assumptions regarding the future development of the heat demand in the buildings. Two different Calculation Modules (CMs) can be used:
      • The CM - Scale heat and cold density maps can be used to recalculate the heat demand in each hectare using the same factor for all hectare elements.
      • The CM - Demand projection can be used to generate future heat demand and floor area density maps based on default development scenarios of the building stock in the EU (link to further info on the default scenarios. It is also possible to adapt several parameters compared to the default calculations such as a reduction of energy demand or a reduction of floor area.
  • Use own data on heat demand density in your region of analysis:
    • It is also possible to upload heat density maps in a raster file format (.tif) to the Hotmaps toolbox when creating a user account and logging-in to the profile section. Uploaded heat demand density layers can reflect the current situation of heat demand densities in the region of interest, or also a possible future scenario of heat demand densities, depending on the input data used for generating the respective layers. More information on how to create a user account and how to upload your own data can be found here.
    • It is also possible to further adapt the own heat density maps with the CM - Scale heat and cold density maps or via the CM - Demand projection like for the default layer.

The developed heat demand and floor area density maps are further used in the subsequent steps in other Calculation Modules (CMs).