

not logged in | [Login]
![]()
 The steps to analyse the potentials for excess heat and renewable energy are highlighted above.
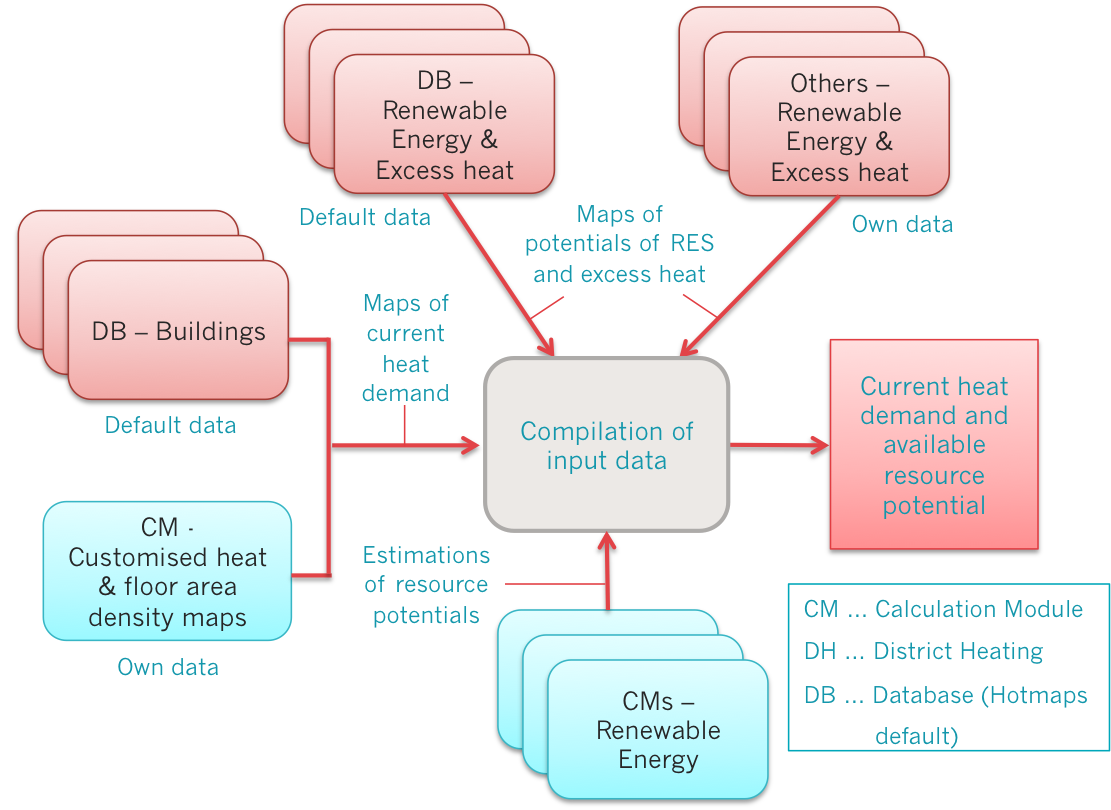
In the next step, the potentials for excess heat and renewable energy in the regions that have been identified as potentially interesting for district heating can be analysed. These data together with the data on heat demand and heat demand density in the regions collected in the previous step can then be used to characterise representative district heating areas for further analysis steps. The following list gives an overview of the heat sources that should be taken into account and links to the default data for the respective energy source, which is available in the Hotmaps database:
The following figure shows this procedure graphically and shows the various data sources and calculation modules that can be used.
 Identification of different representative, typical cases for district heating (Step 1).