

not logged in | [Login]
![]()
Depending on the layers and region you selected indicators for your configuration are shown in a sidebar at the right of your screen
In the following, we look at the indicators that are displayed for raster and vector layers.
The indicators on raster layers are different from vector layers. With different, we mean in terms of aggregation and disaggregation. This different behaviour comes from territorial resolutions.
Raster Layers have generally a much higher resolution whereas vector layers have only attributes at points or polygons.
That means on the one hand for example that if you select a vector layer which is defined by NUTS3 polygons and you want for example to select an LAU region then the NUTS3 value will not be disaggregated to LAU level, instead, the NUTS3 indicator where this LAU region is located will be shown in the results sidebar.
On the other hand, raster layers are aggregated and disaggregated "arbitrarily"*
*by the containing cells within the region you selected (naturally within the limit of the raster resolution itself)
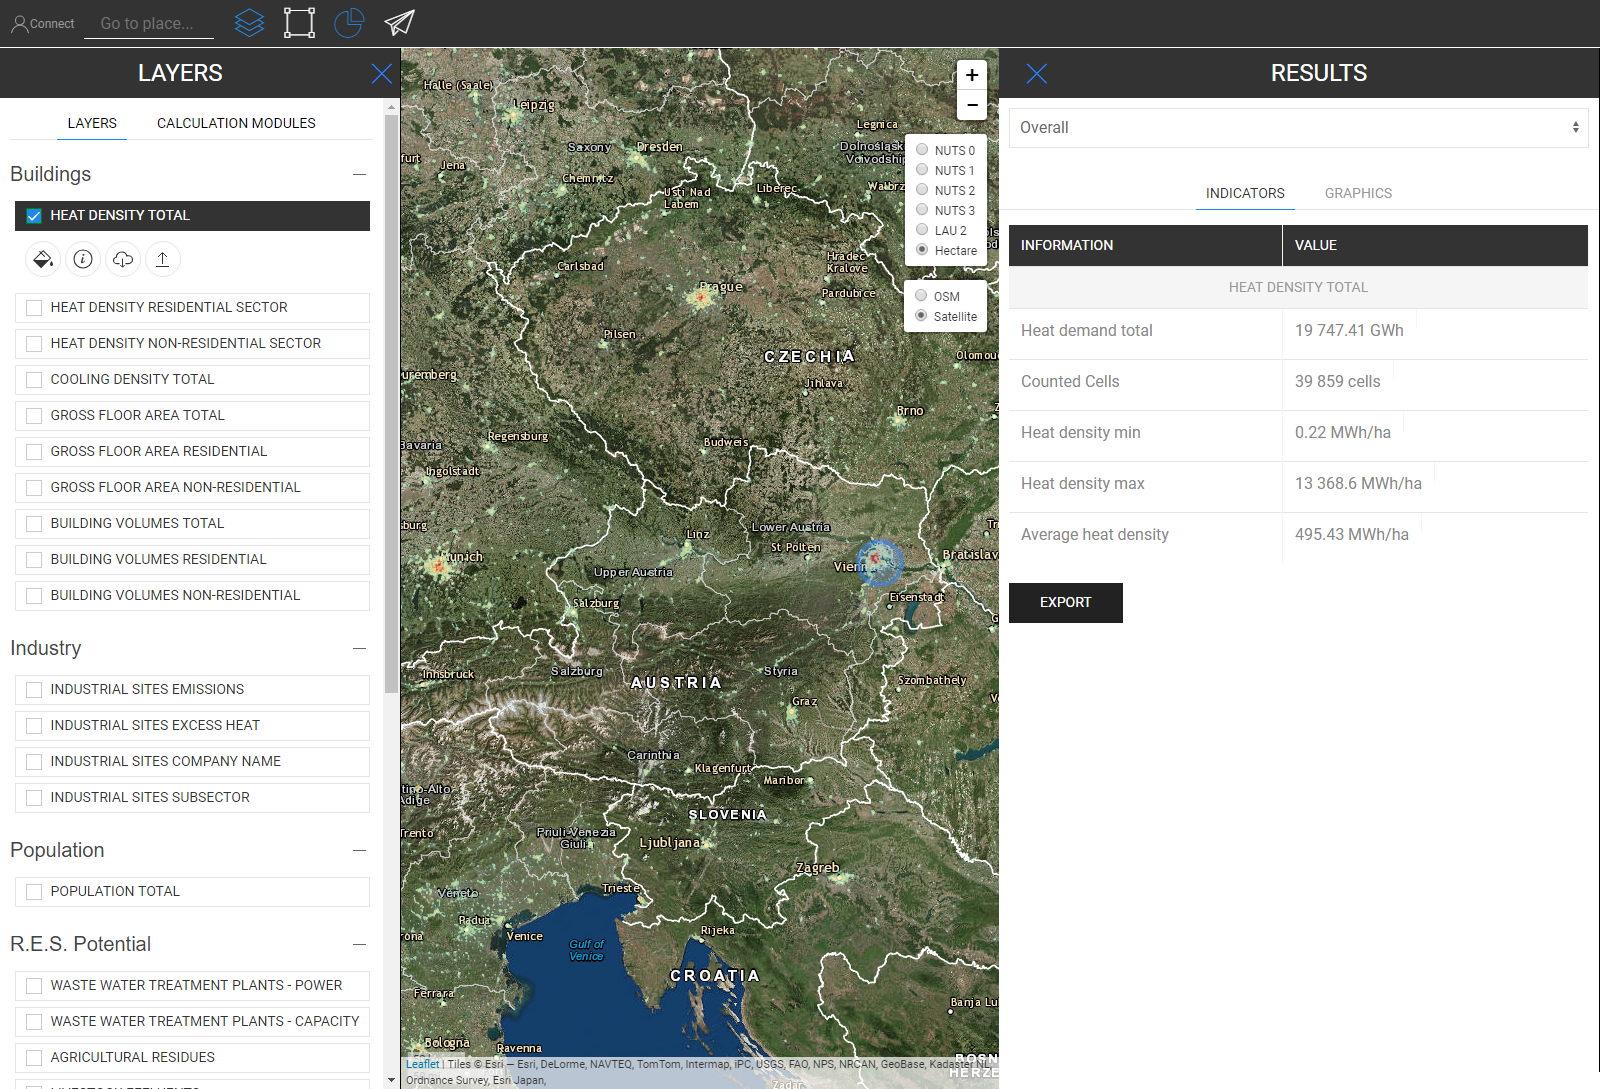
Heat Density Map
Extra Feature
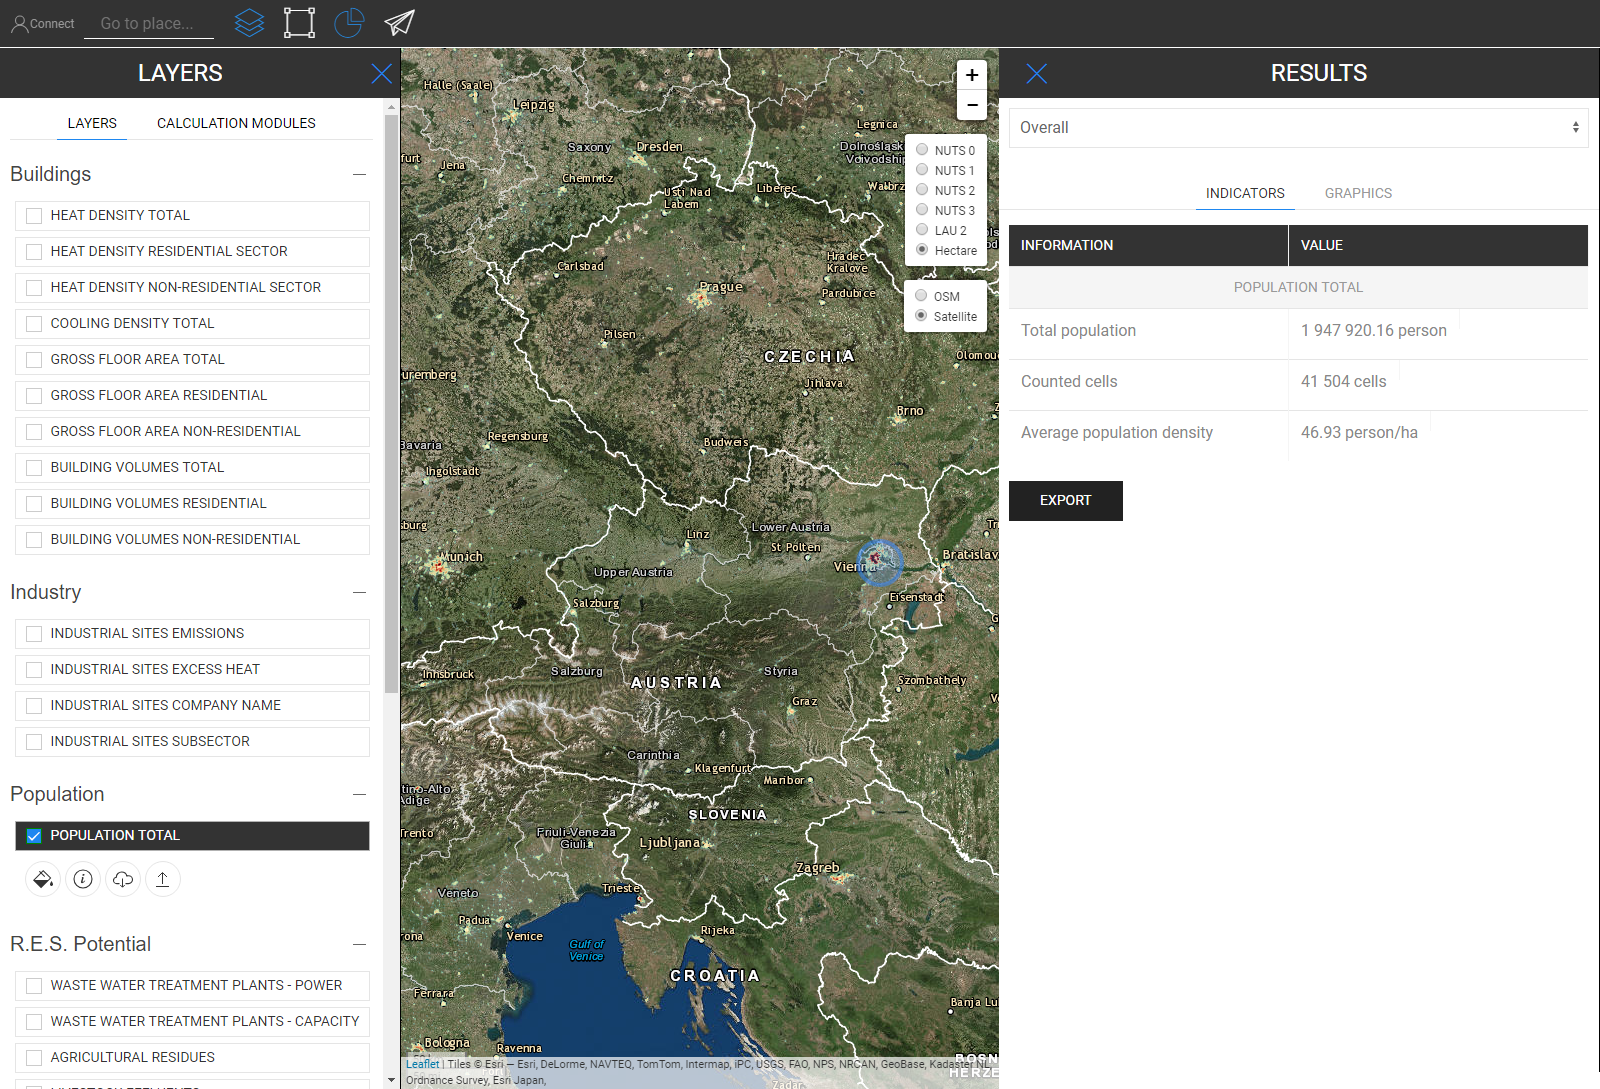
When you select the heat density layer and the Population Layer at the same time an extra indicator is shown (see picture below)
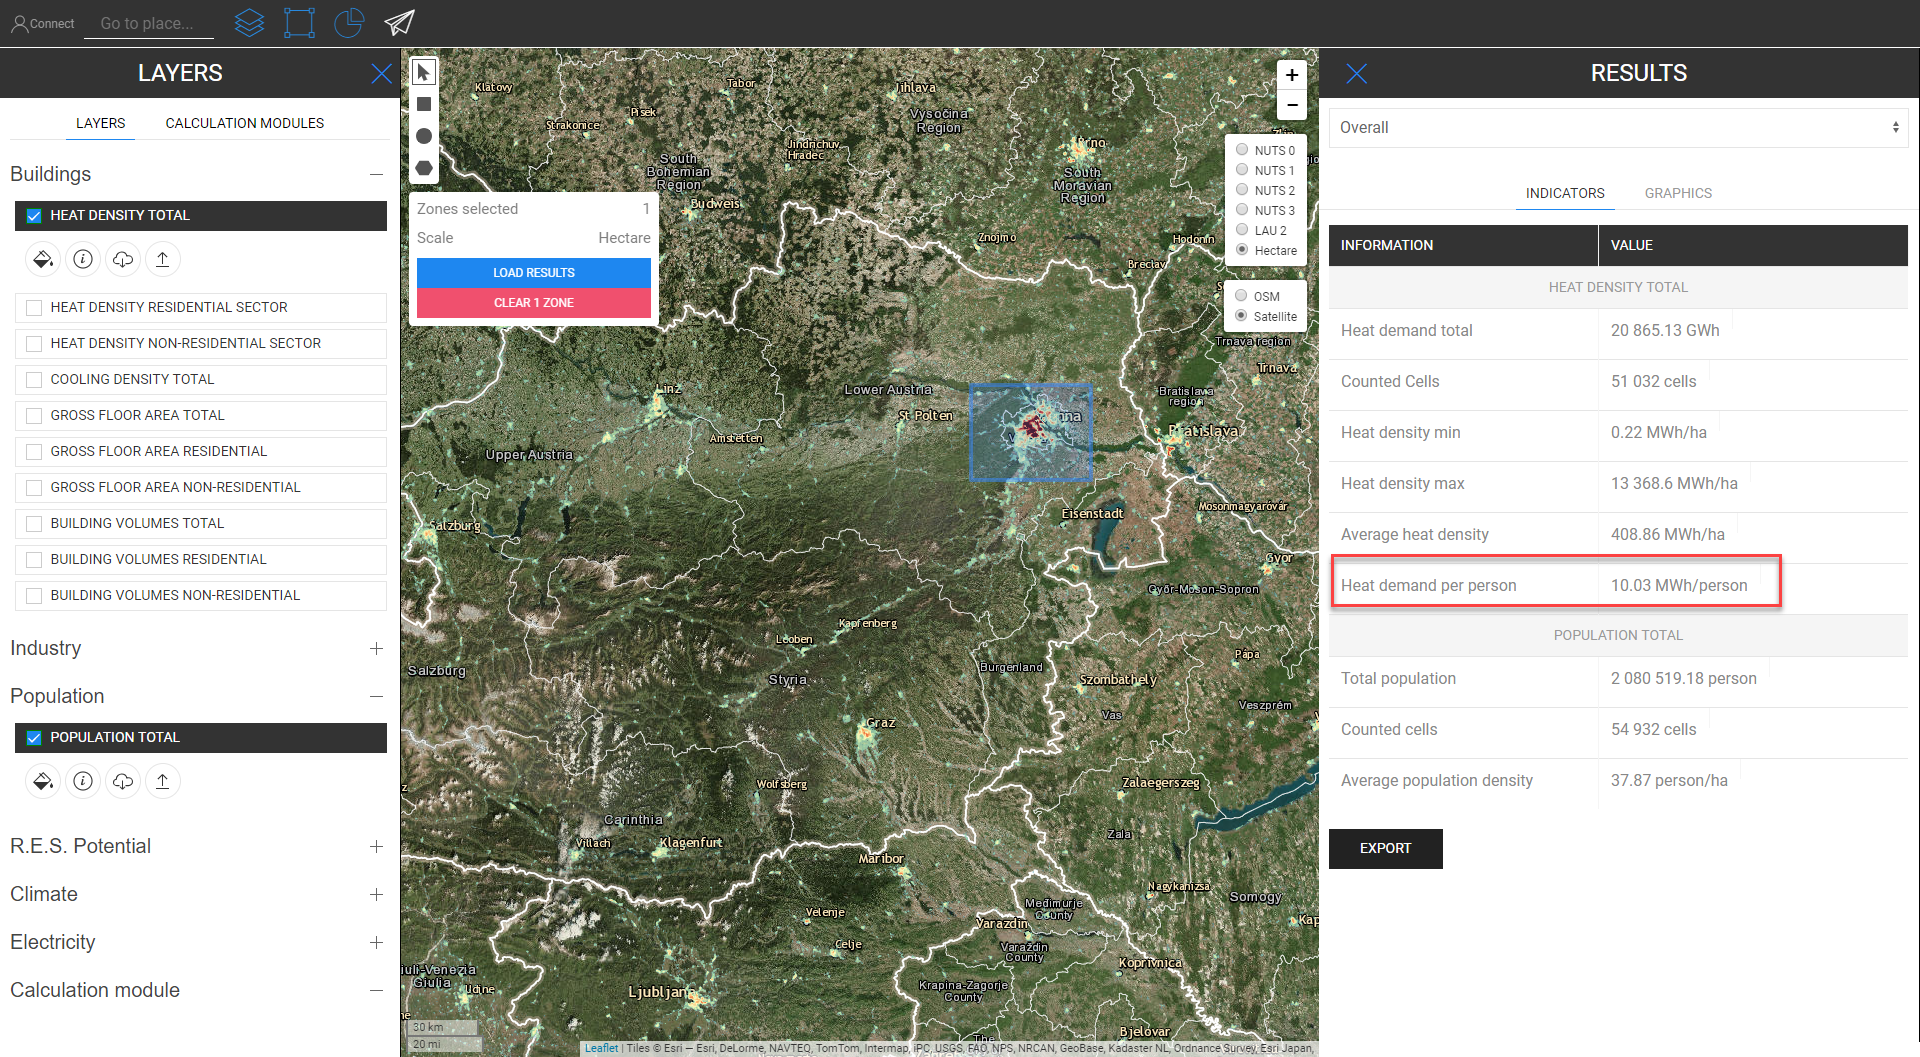
When one of the building layers and the population layer is selected at the same time, an extra indicator will be shown as described before
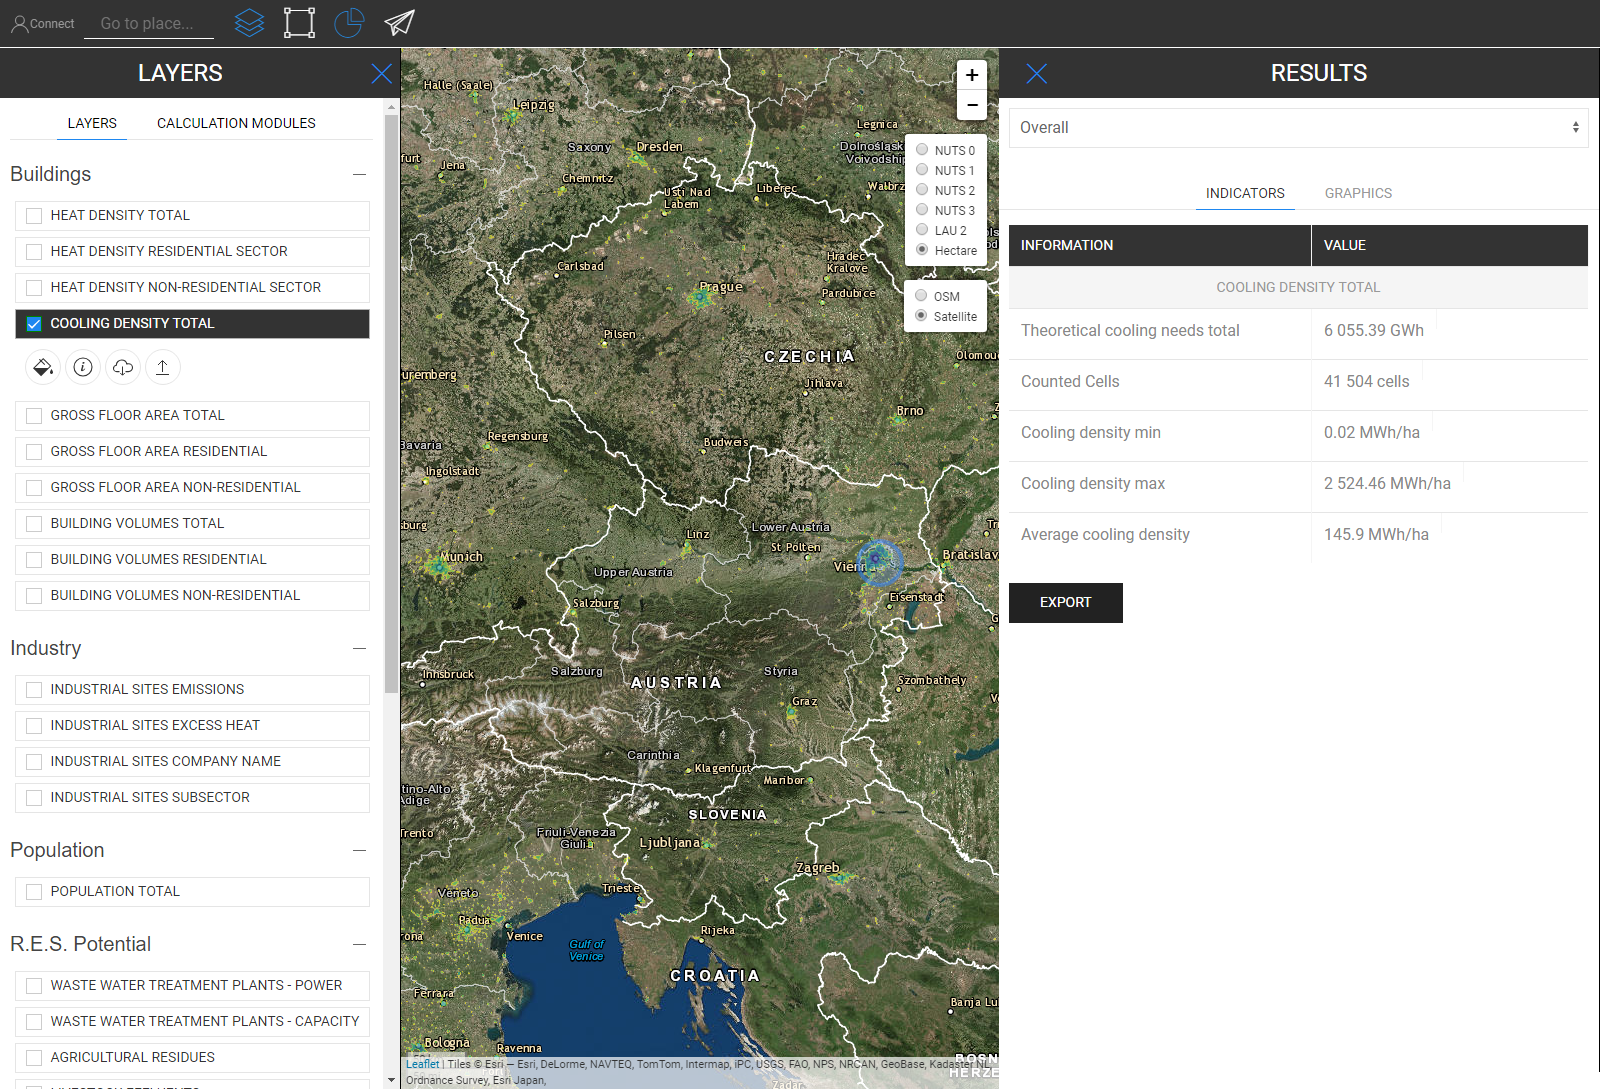
Cooling Density Map
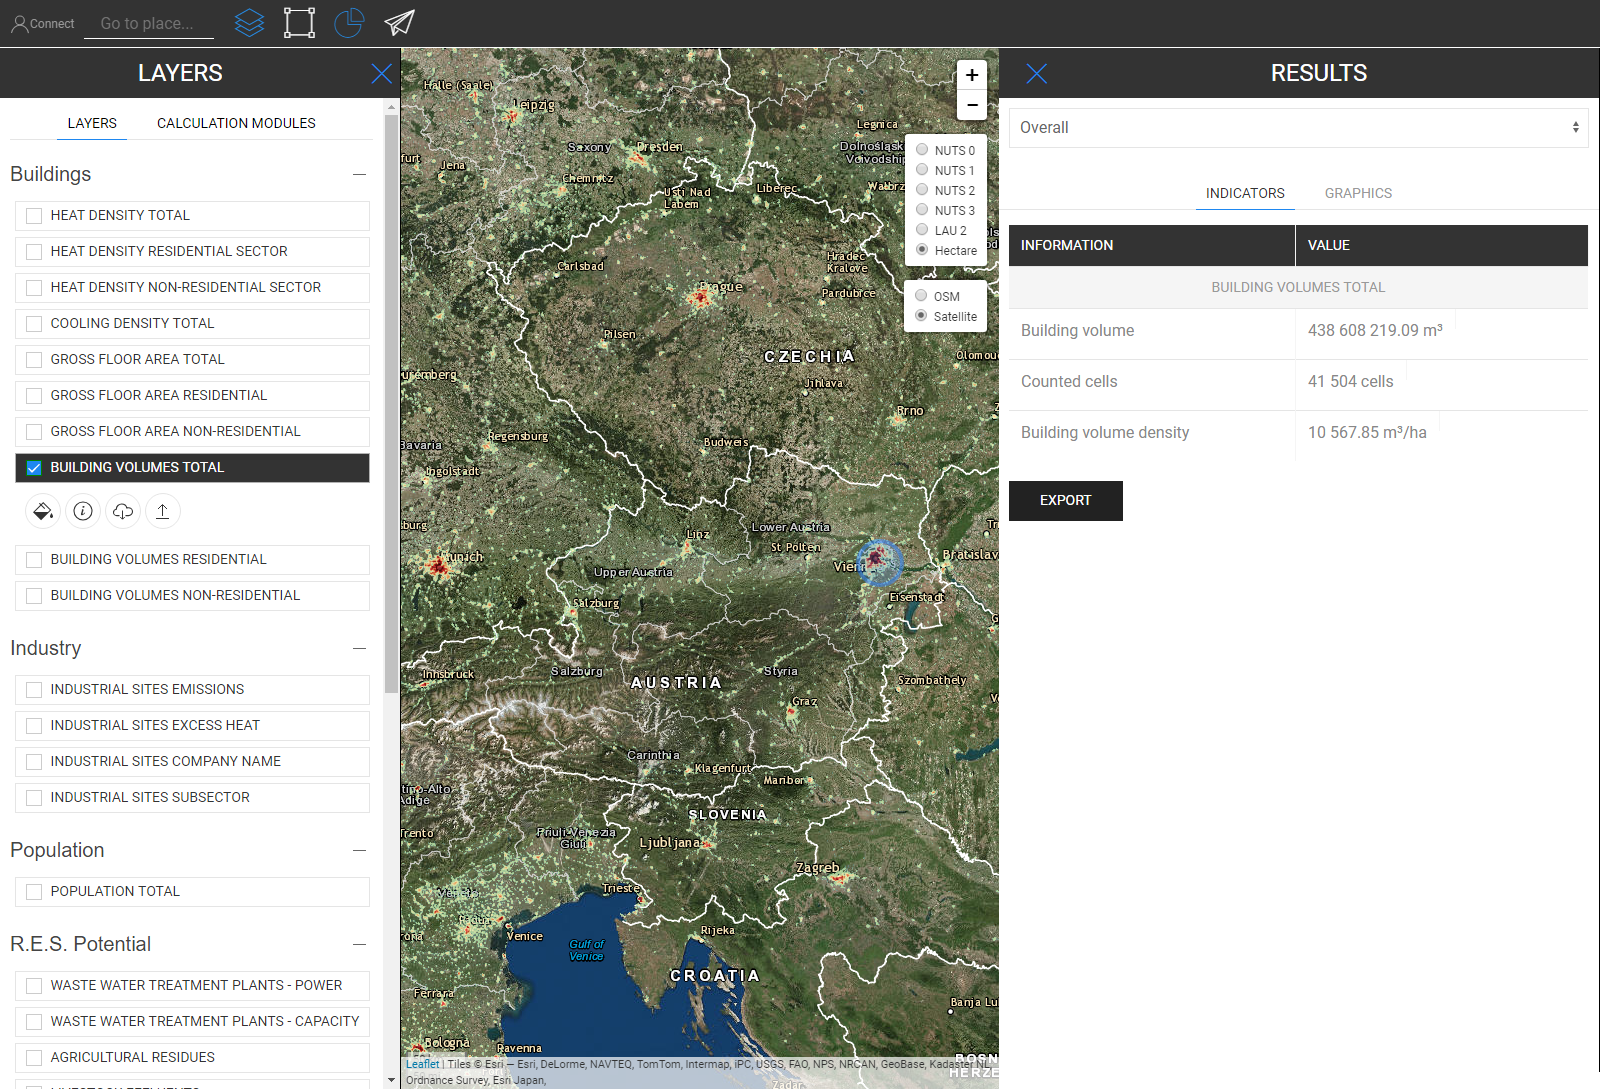
Building Volumes
Gross floor area

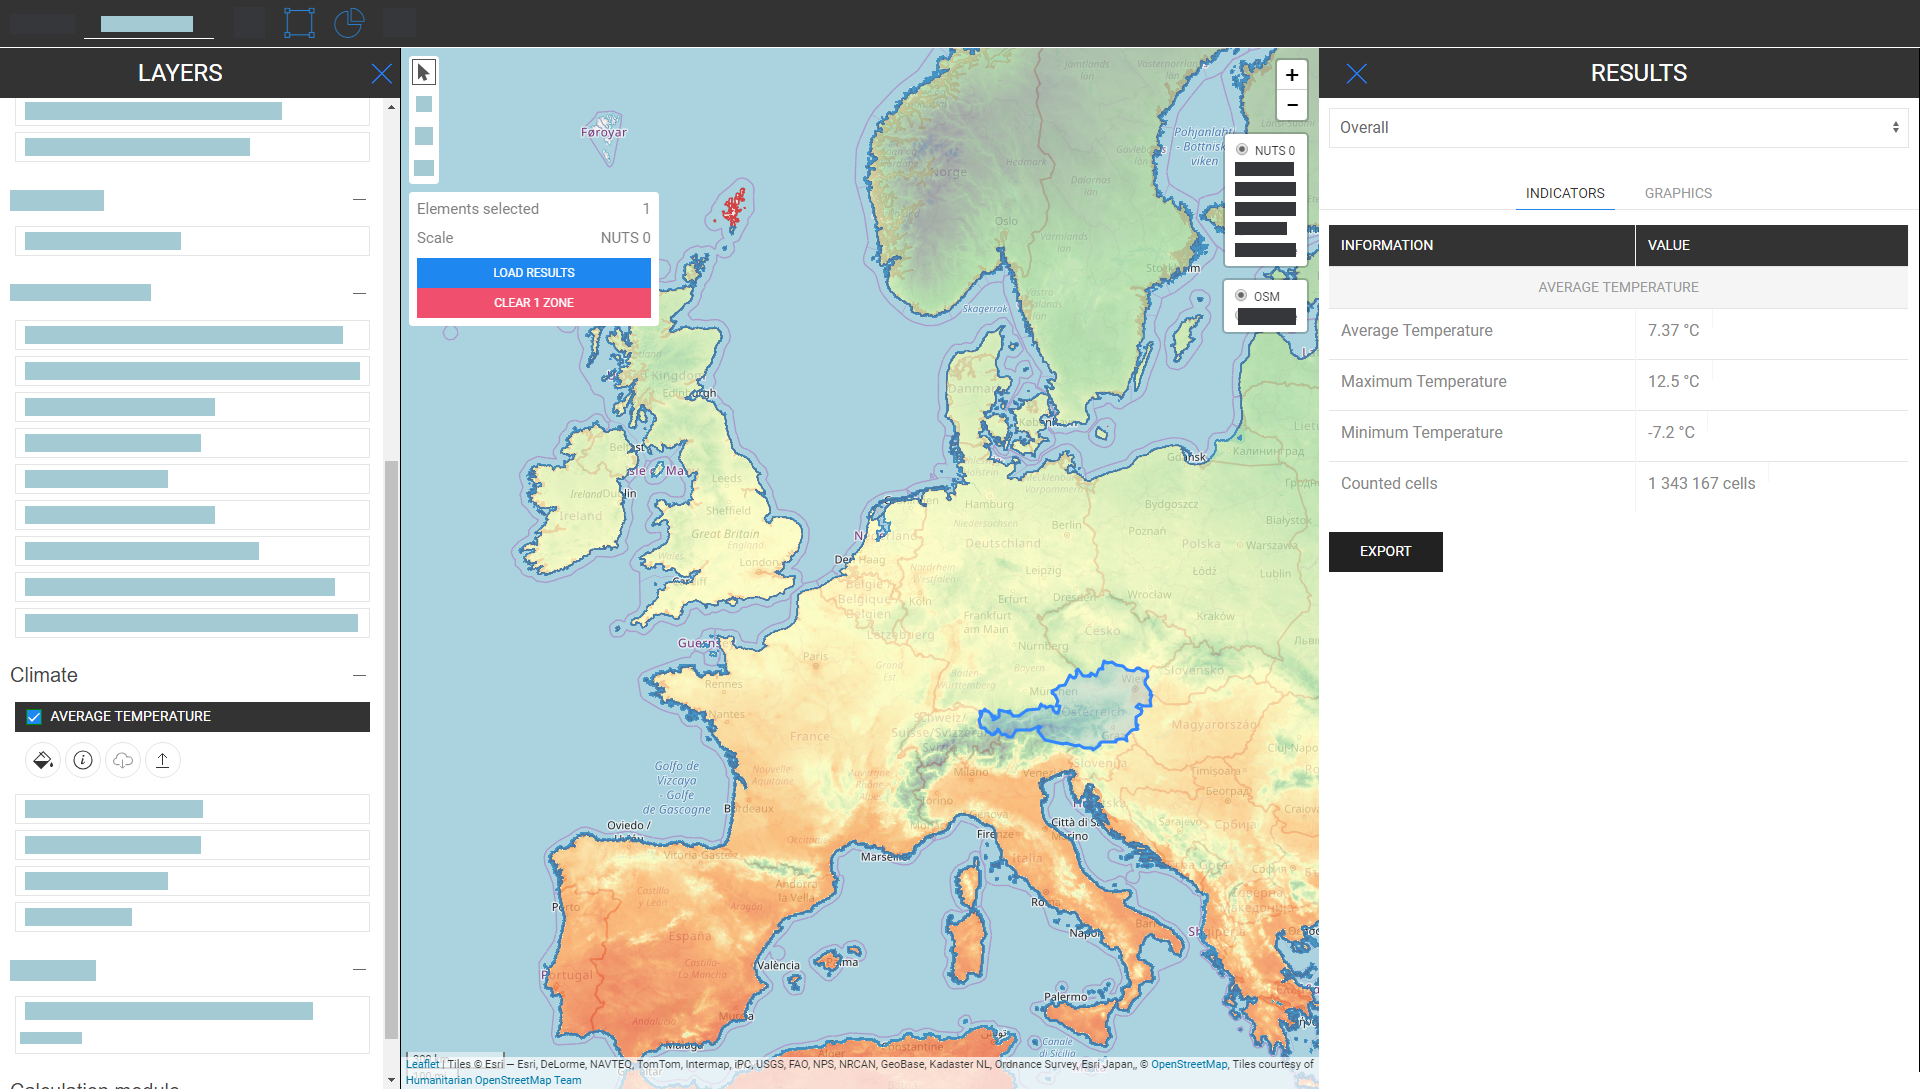
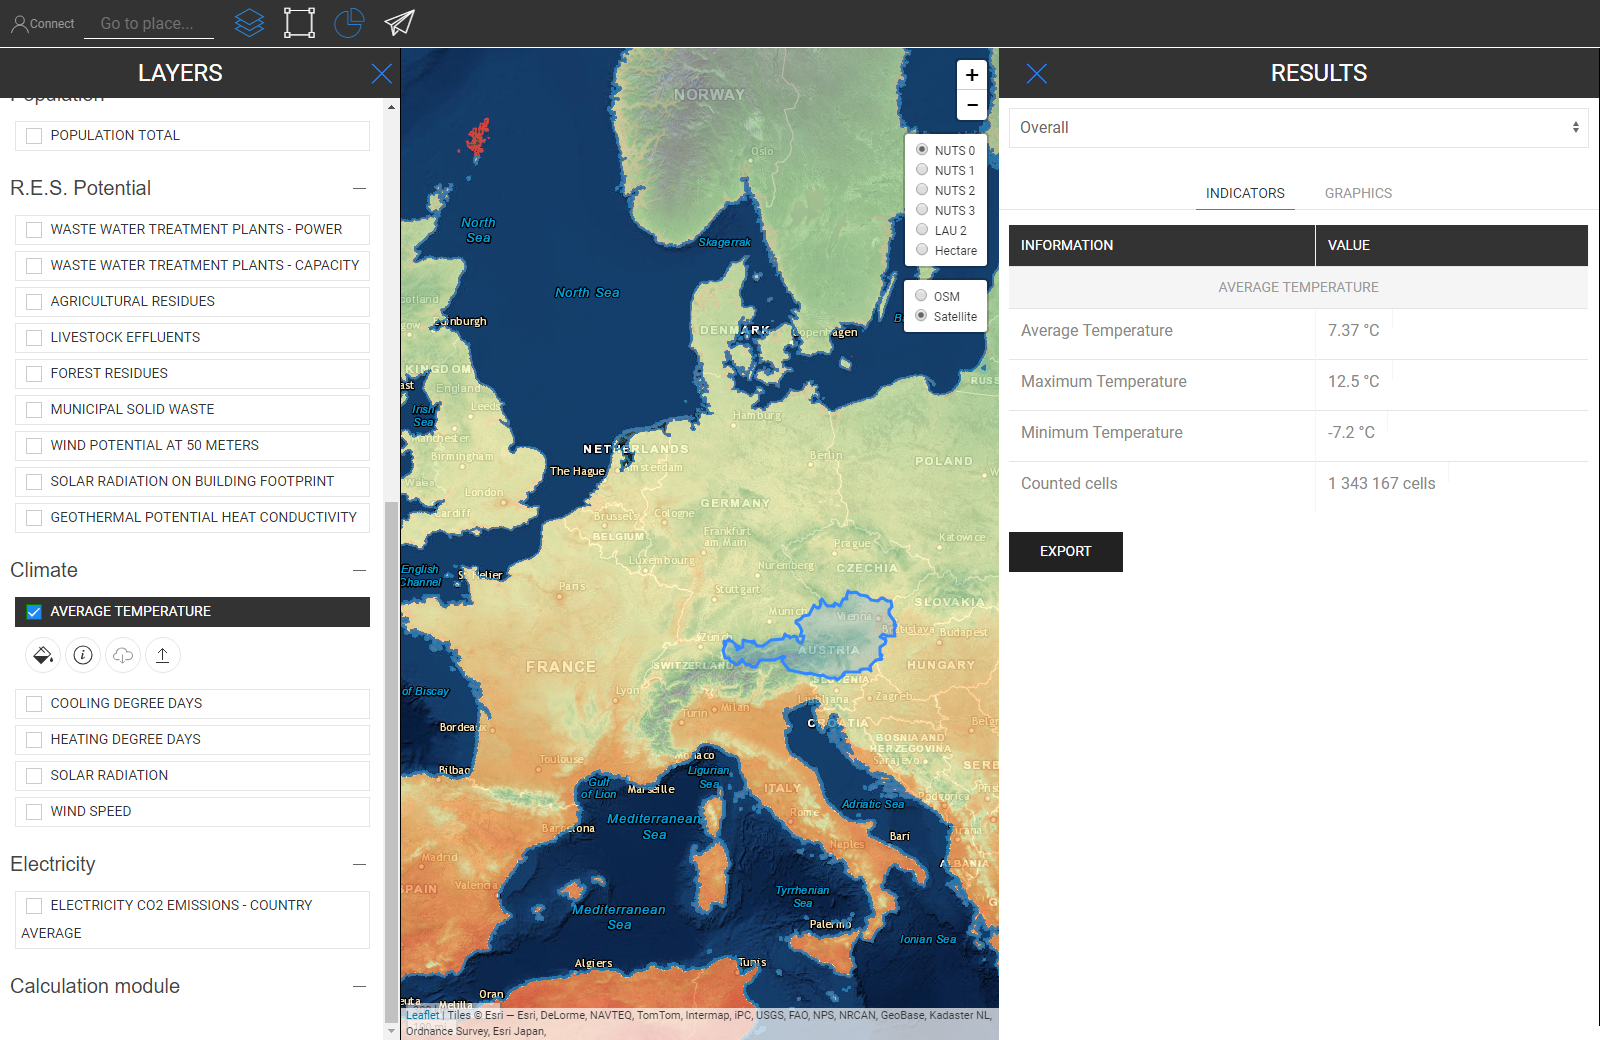
Temperature
Cooling Degree Days

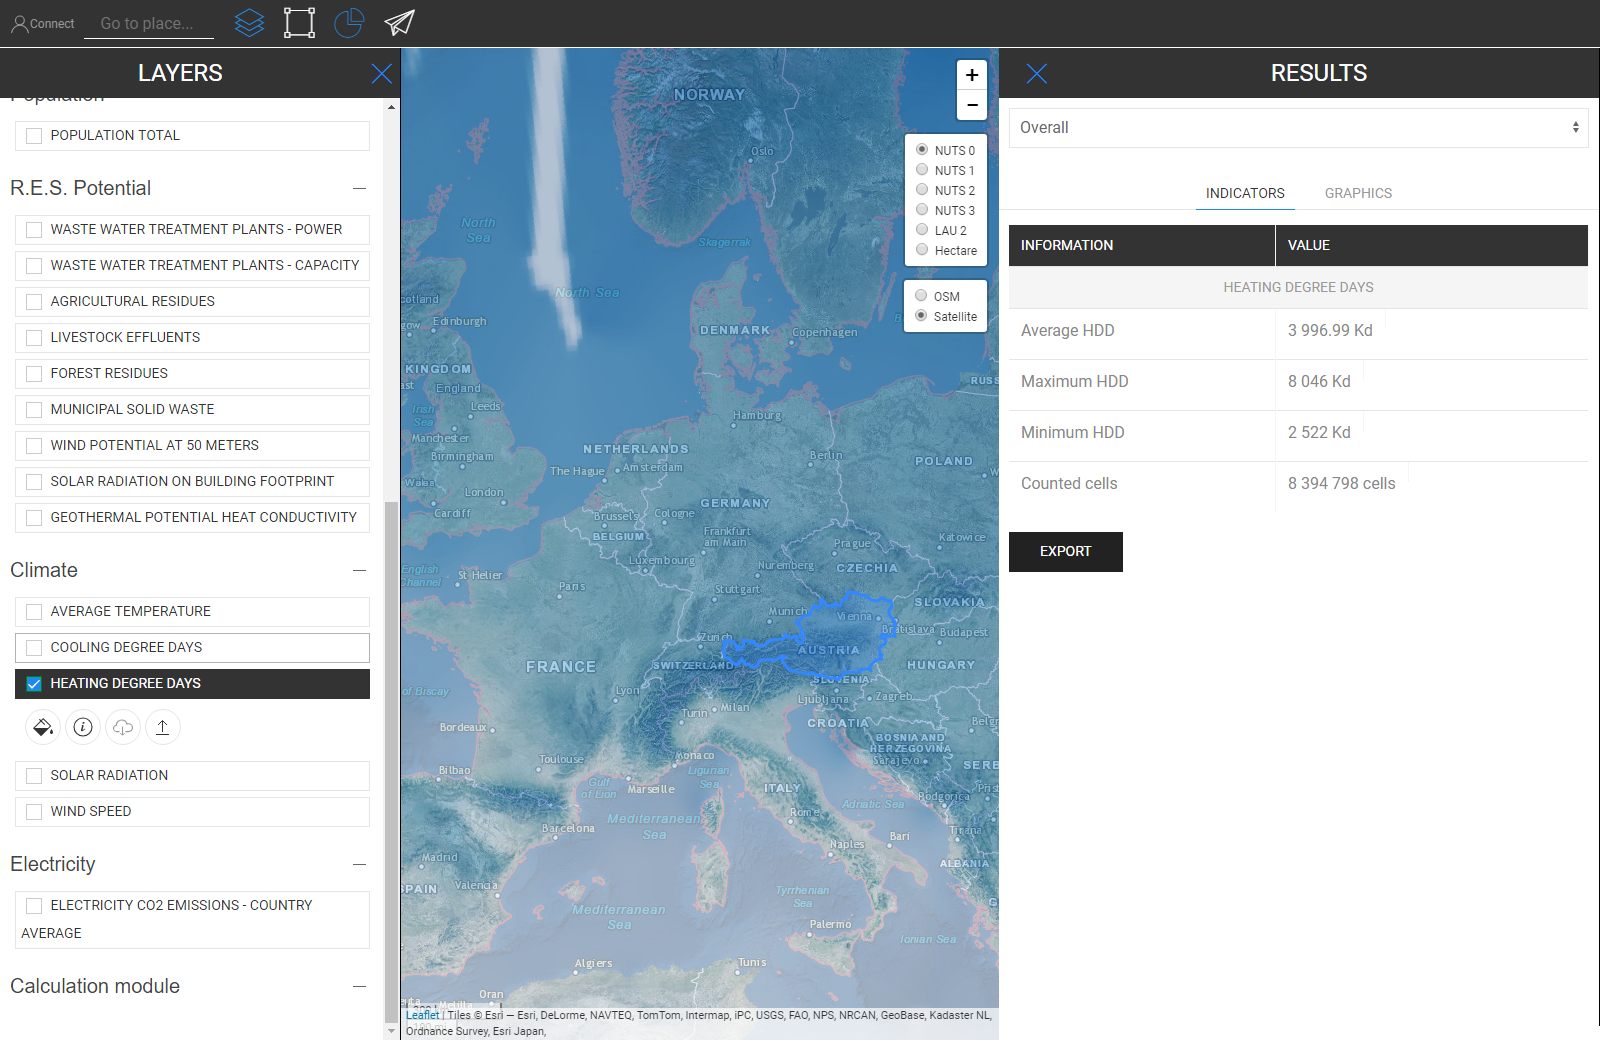
Heating Degree Days
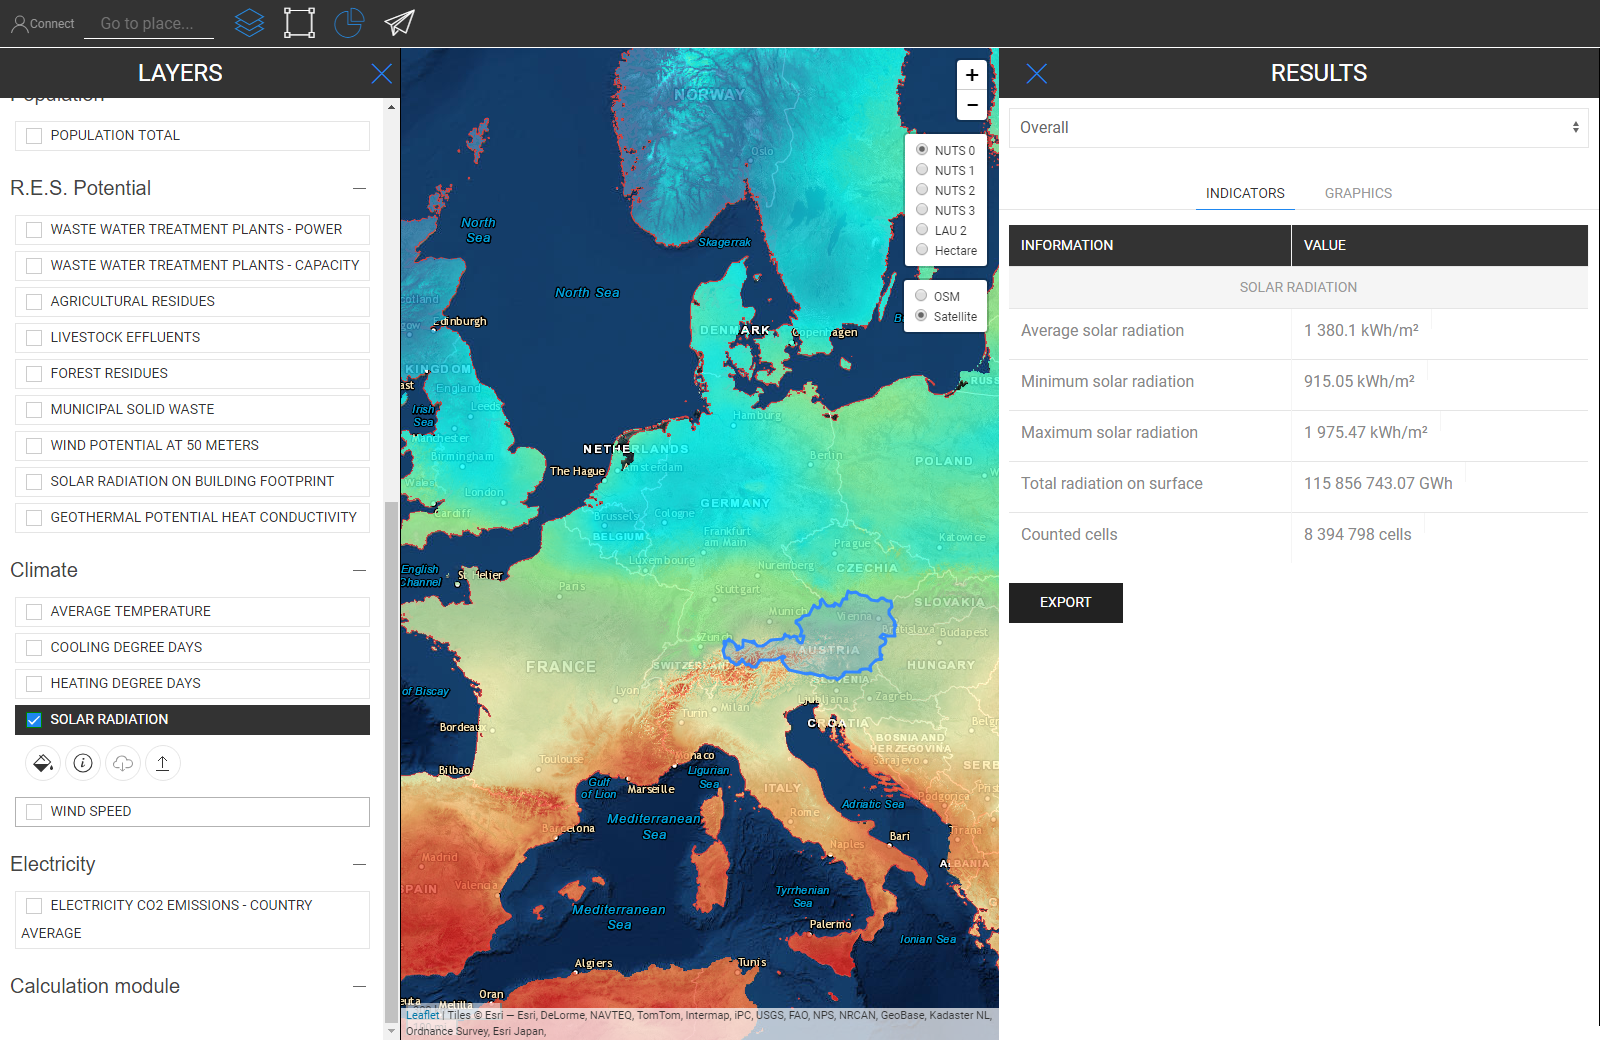
Solar Radiation
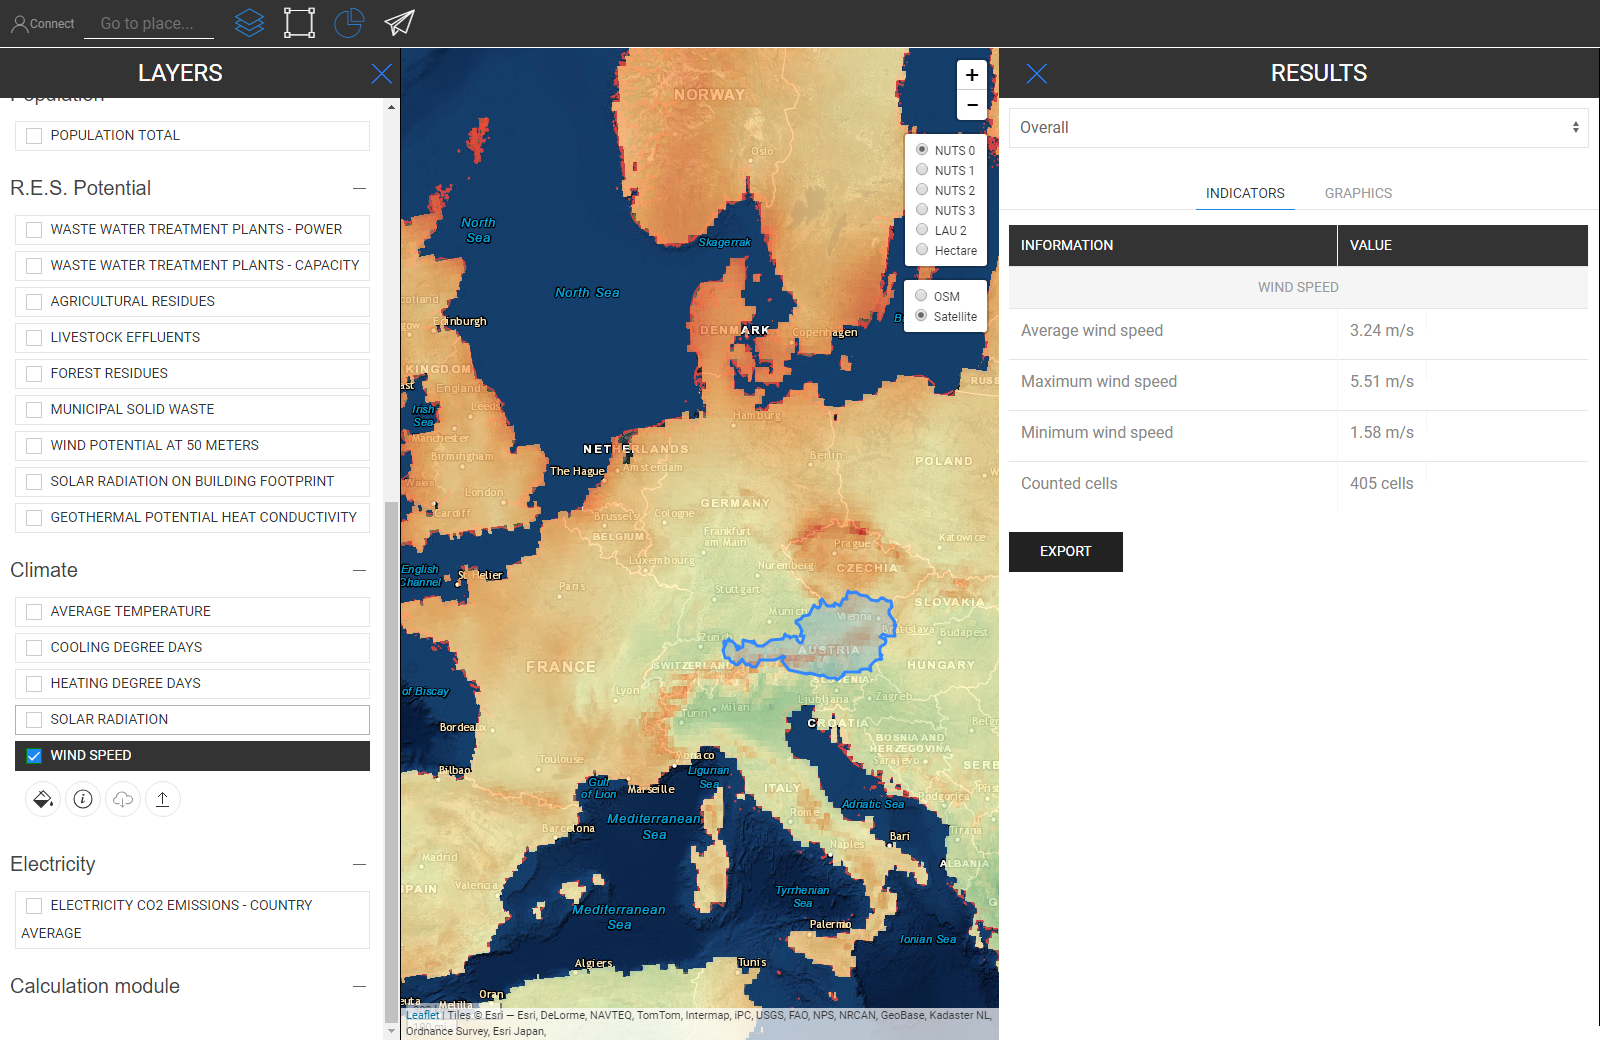
Wind Speed
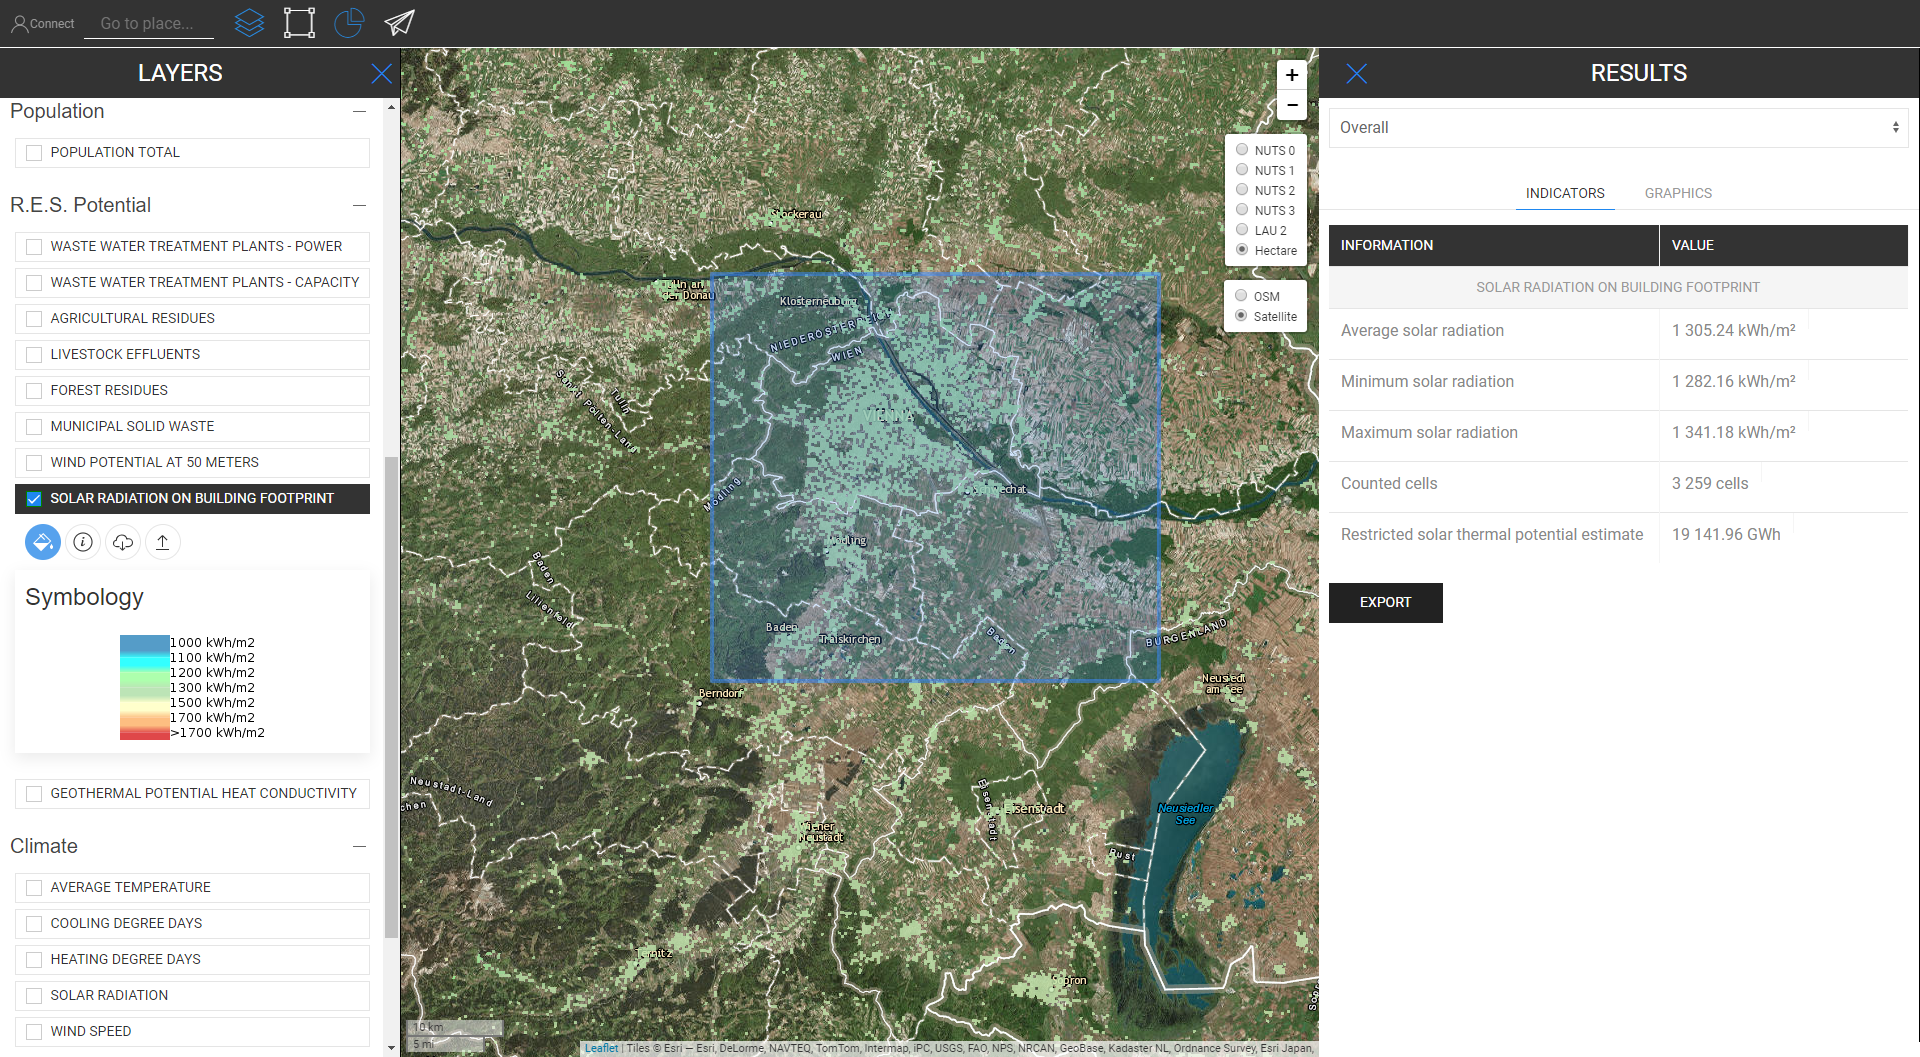
Solar Radiation On Building Footprint
Wind Potential at 50m

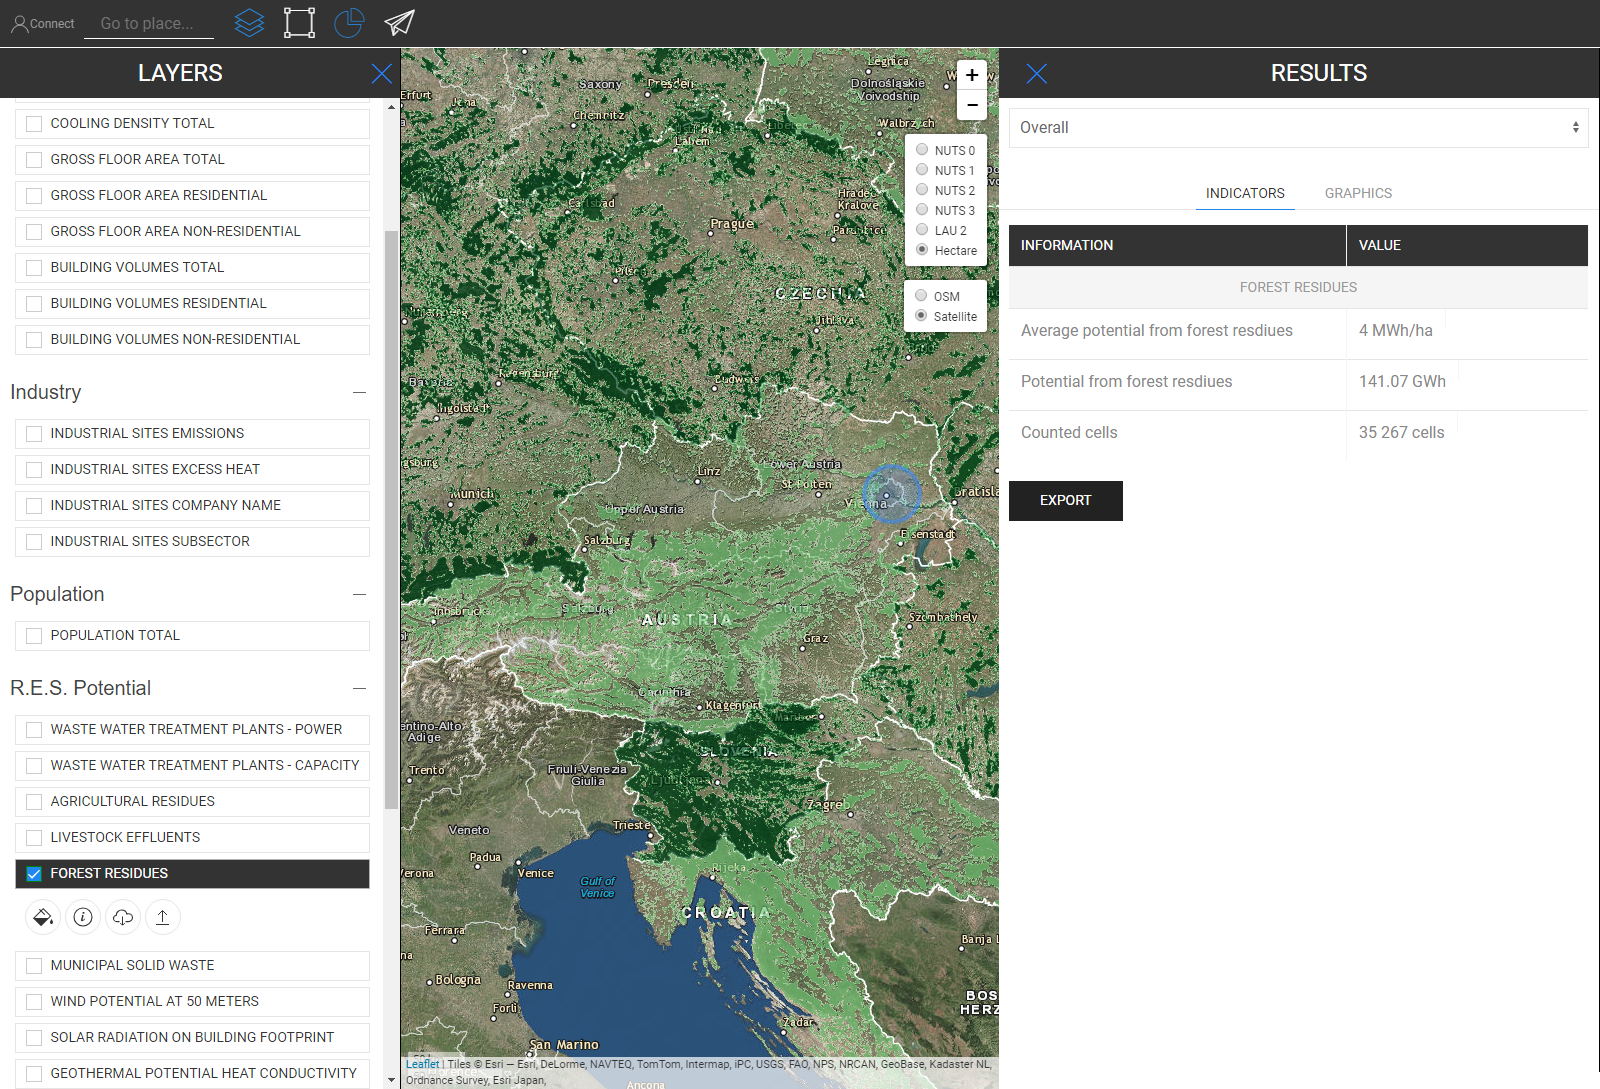
Forest Residues
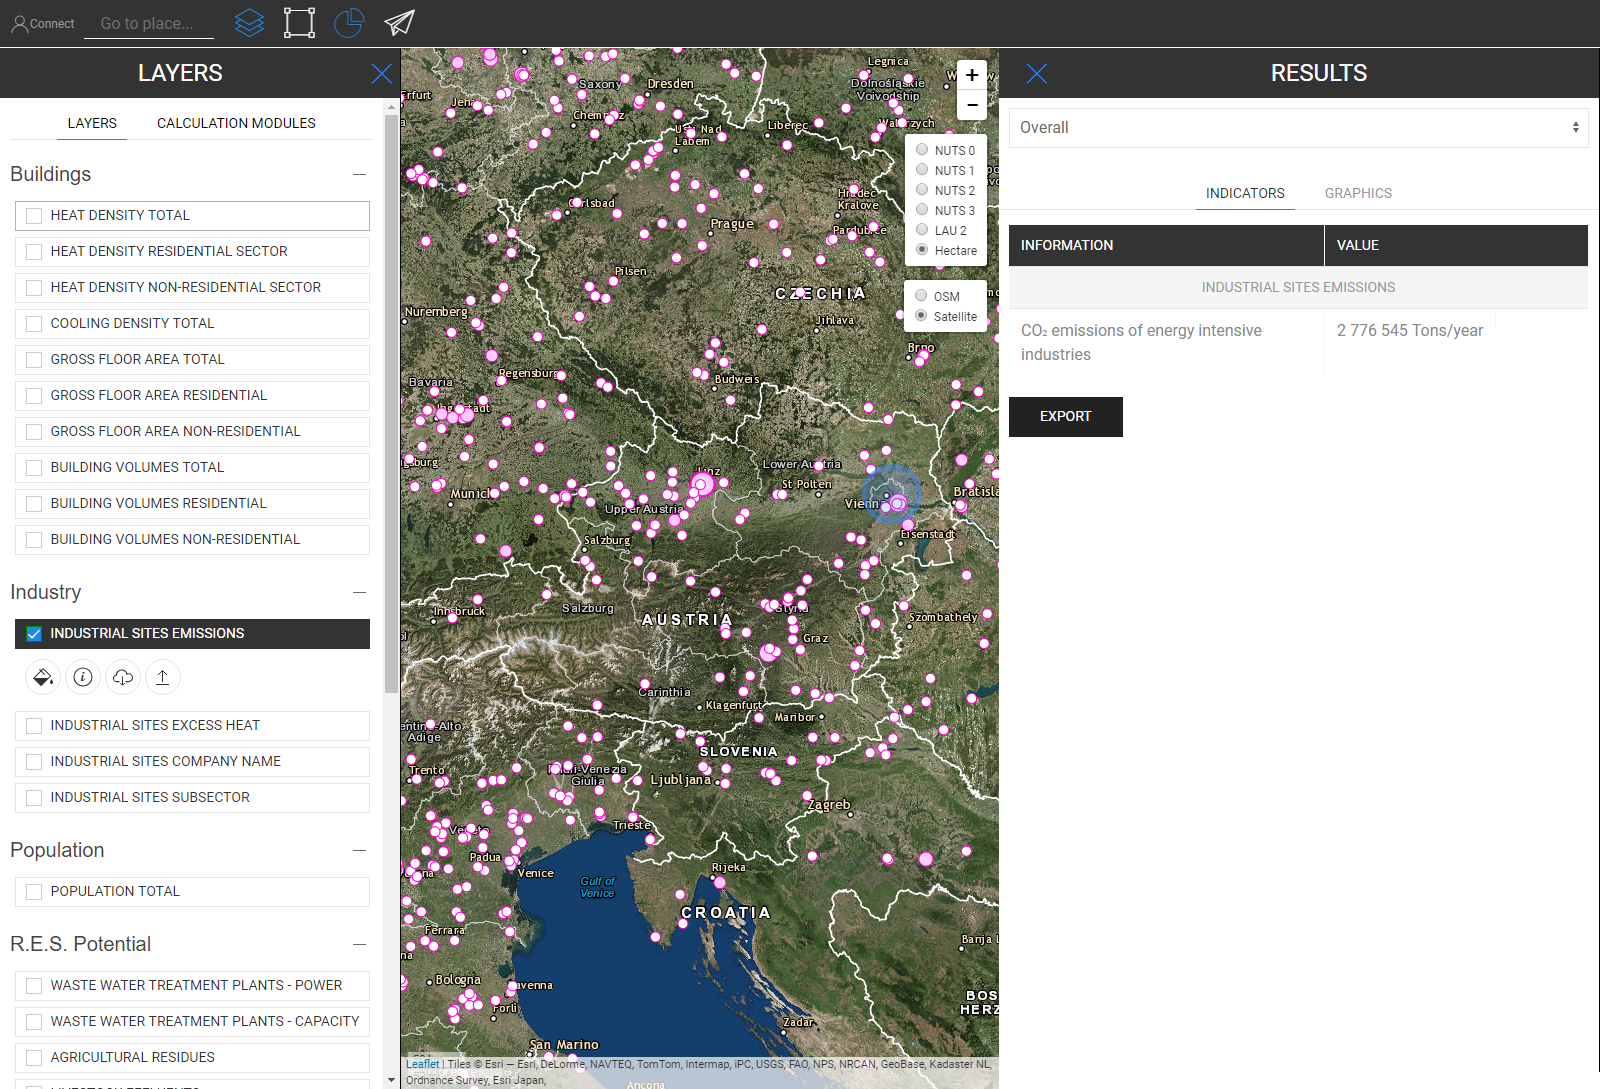
Industrial Site Emissions
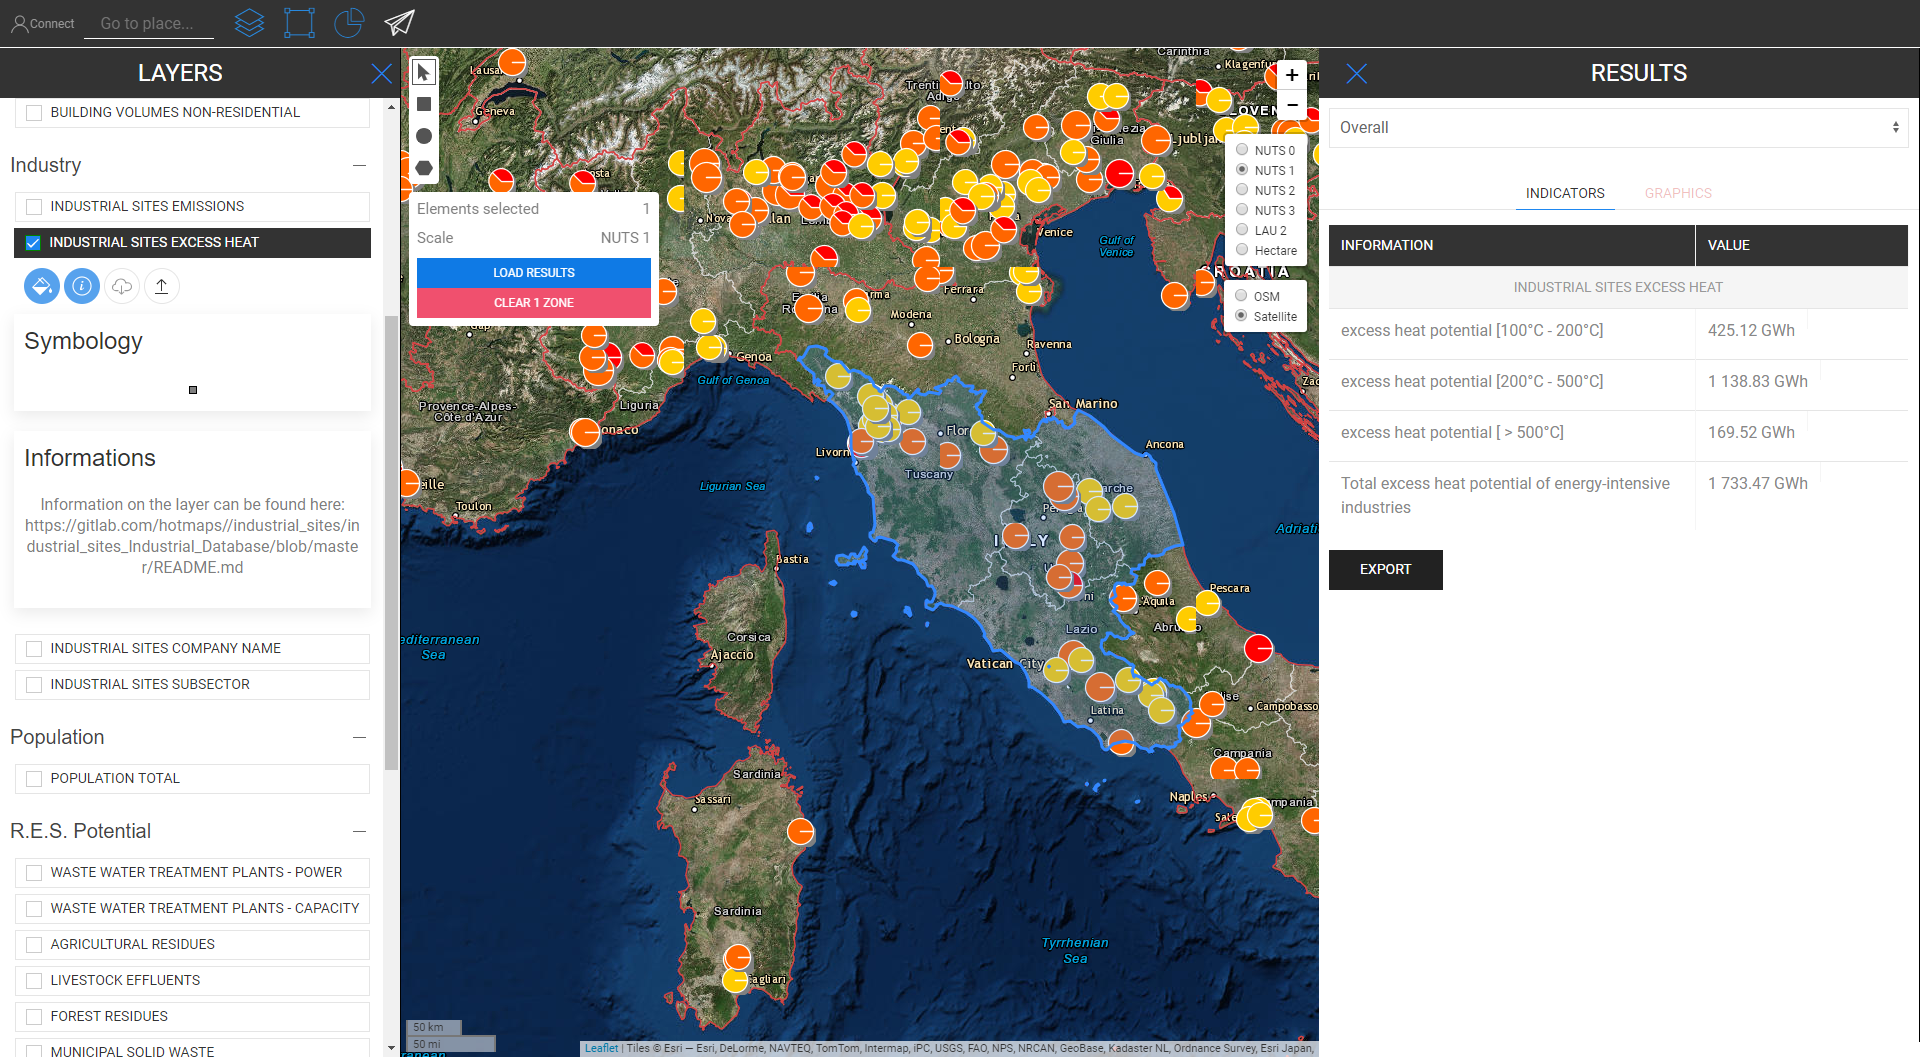
Industrial Site Excess Heat
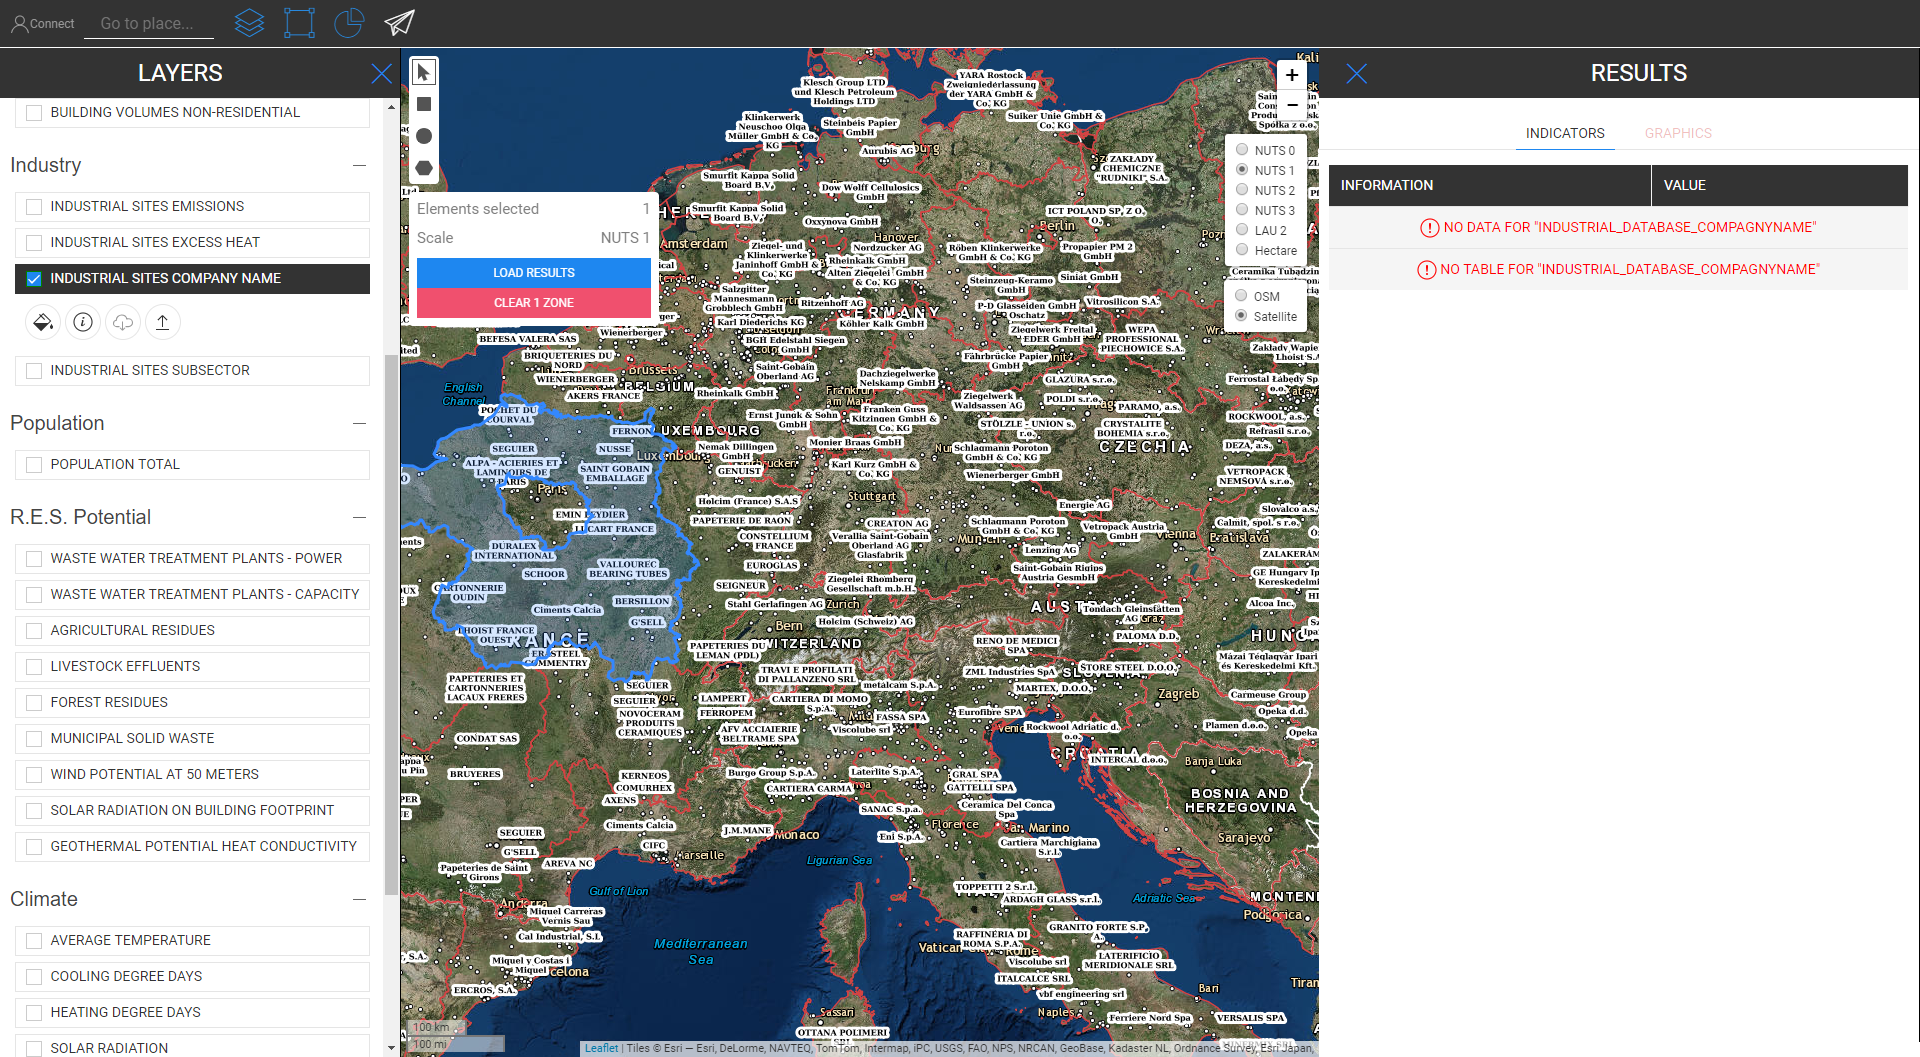
Industrial Site Company Name
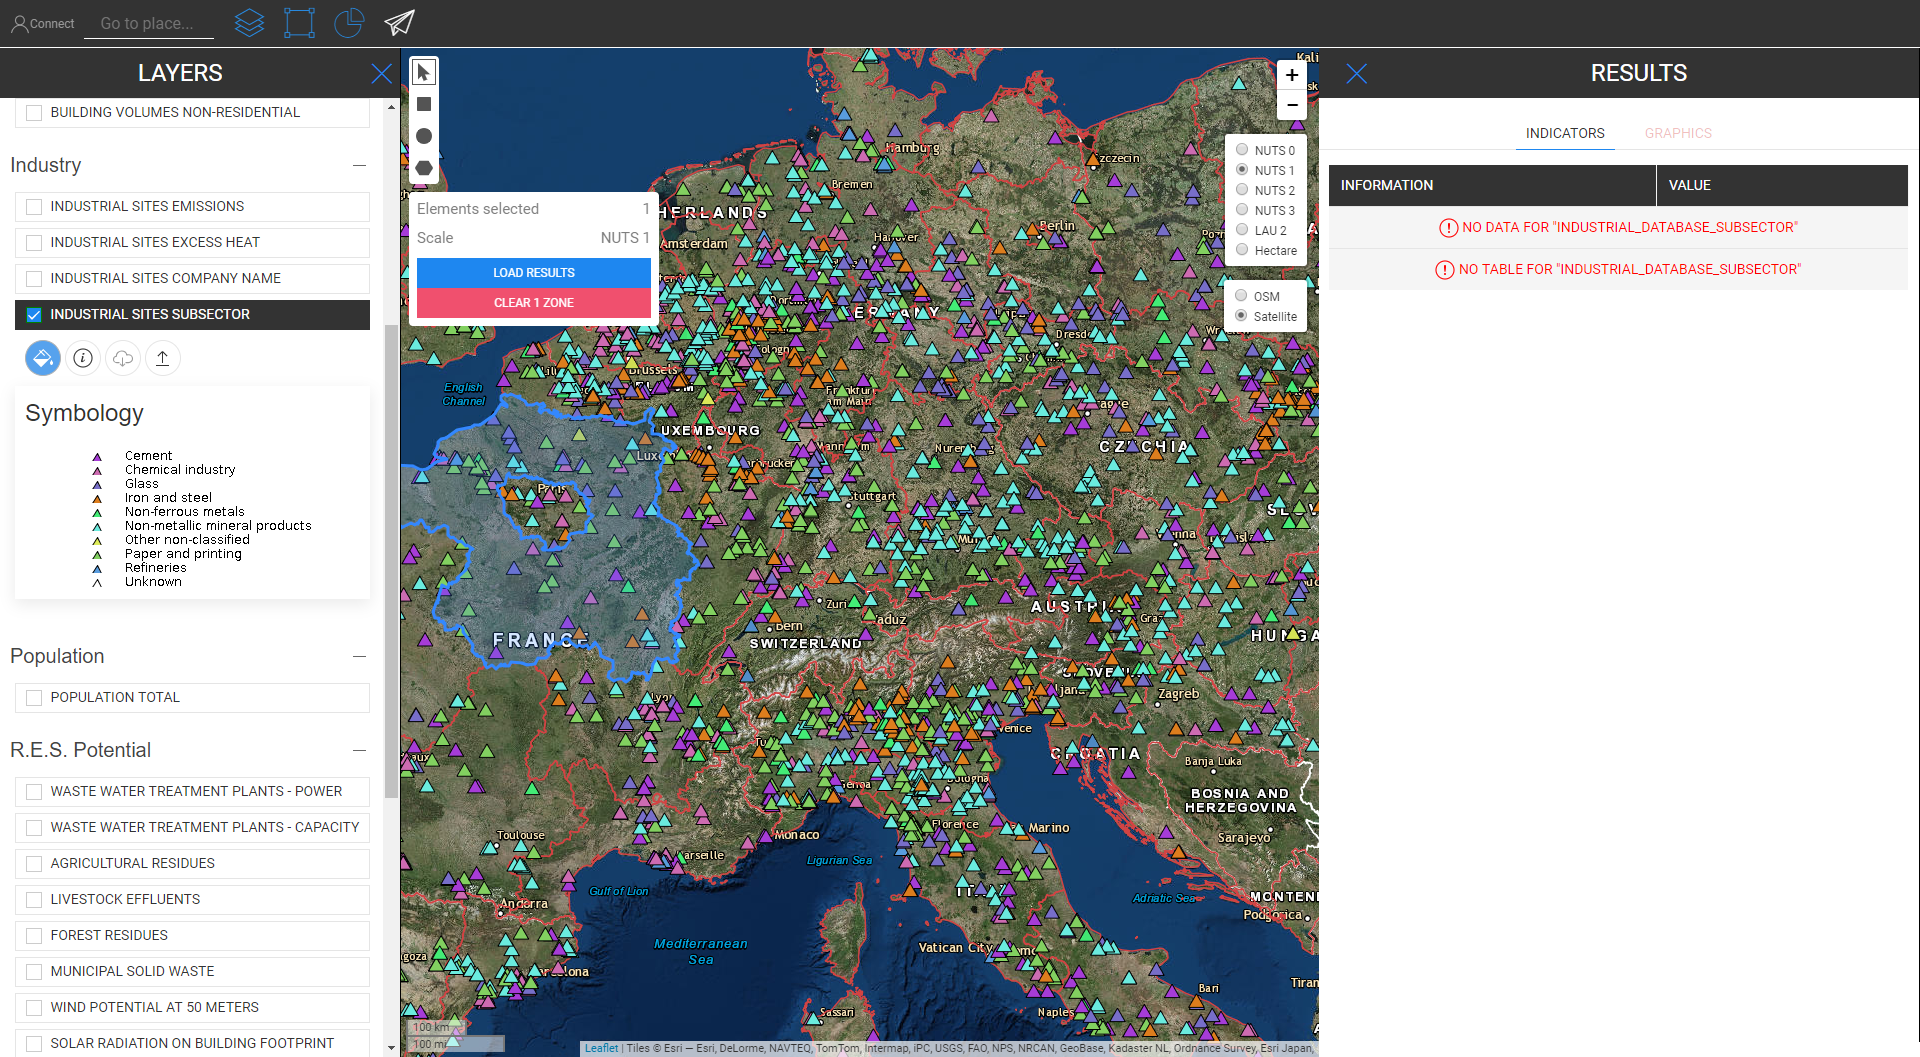
Industrial Site Subsector
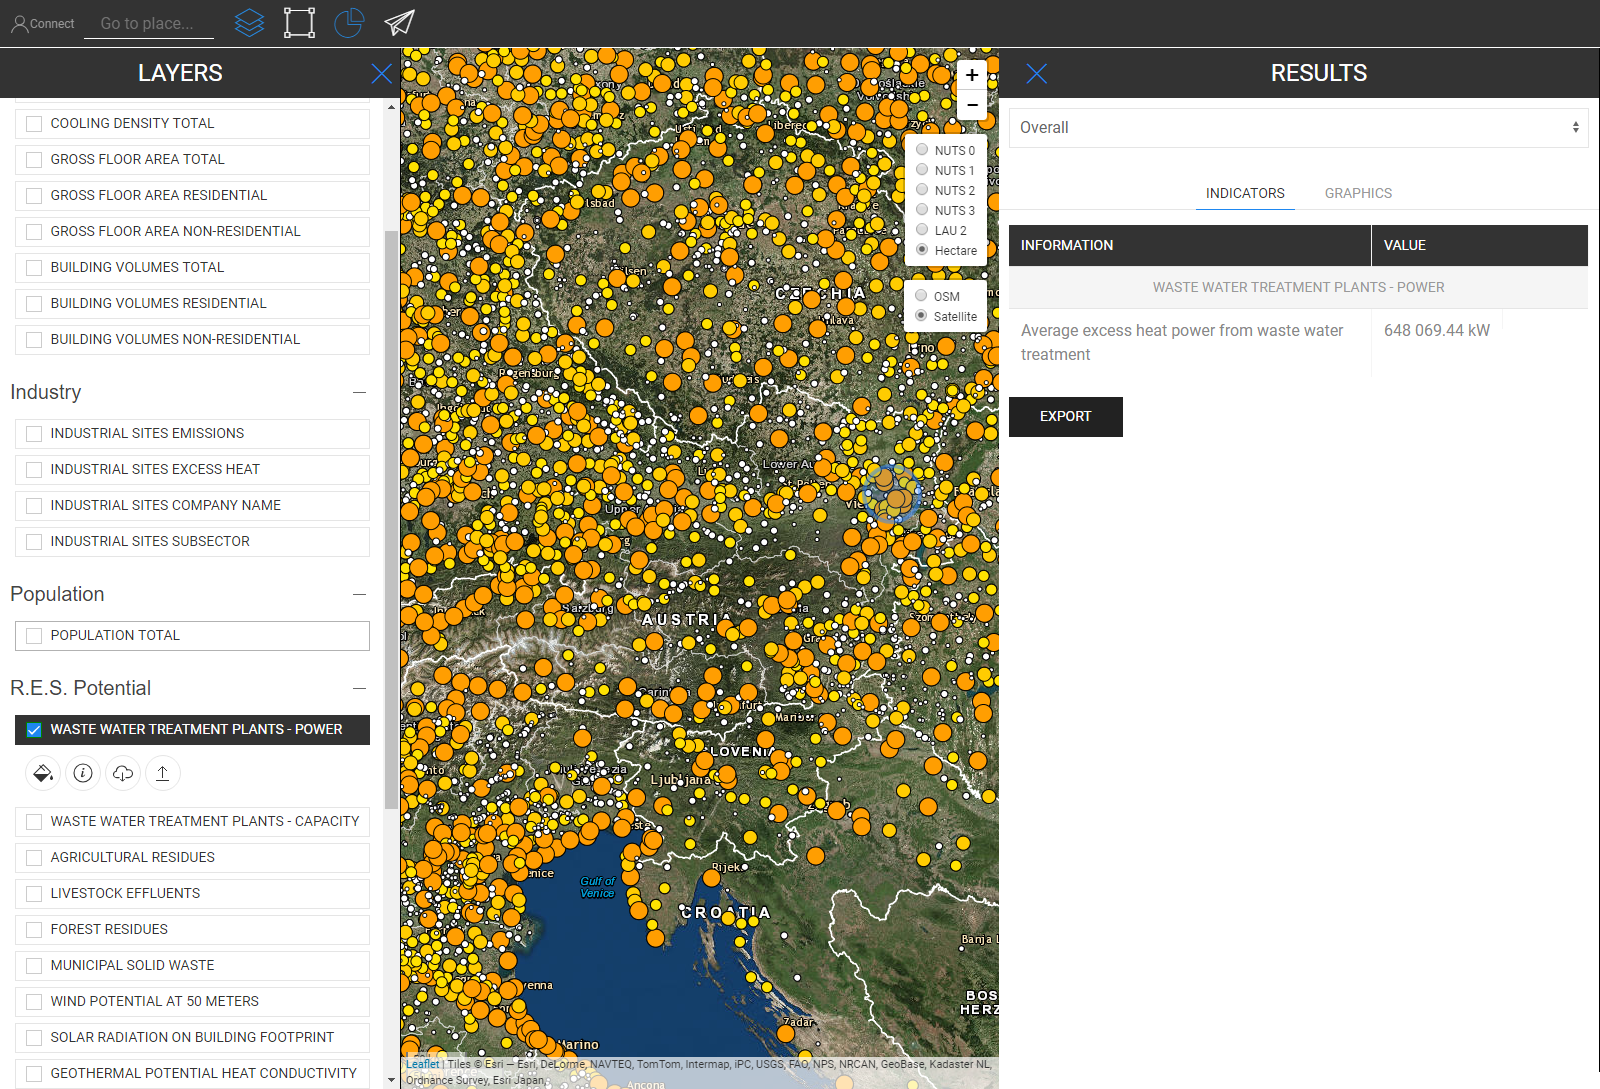
Waste Water Treatment Plants Power
Waste Water Treatment Plants Capacity

Agricultural Residues

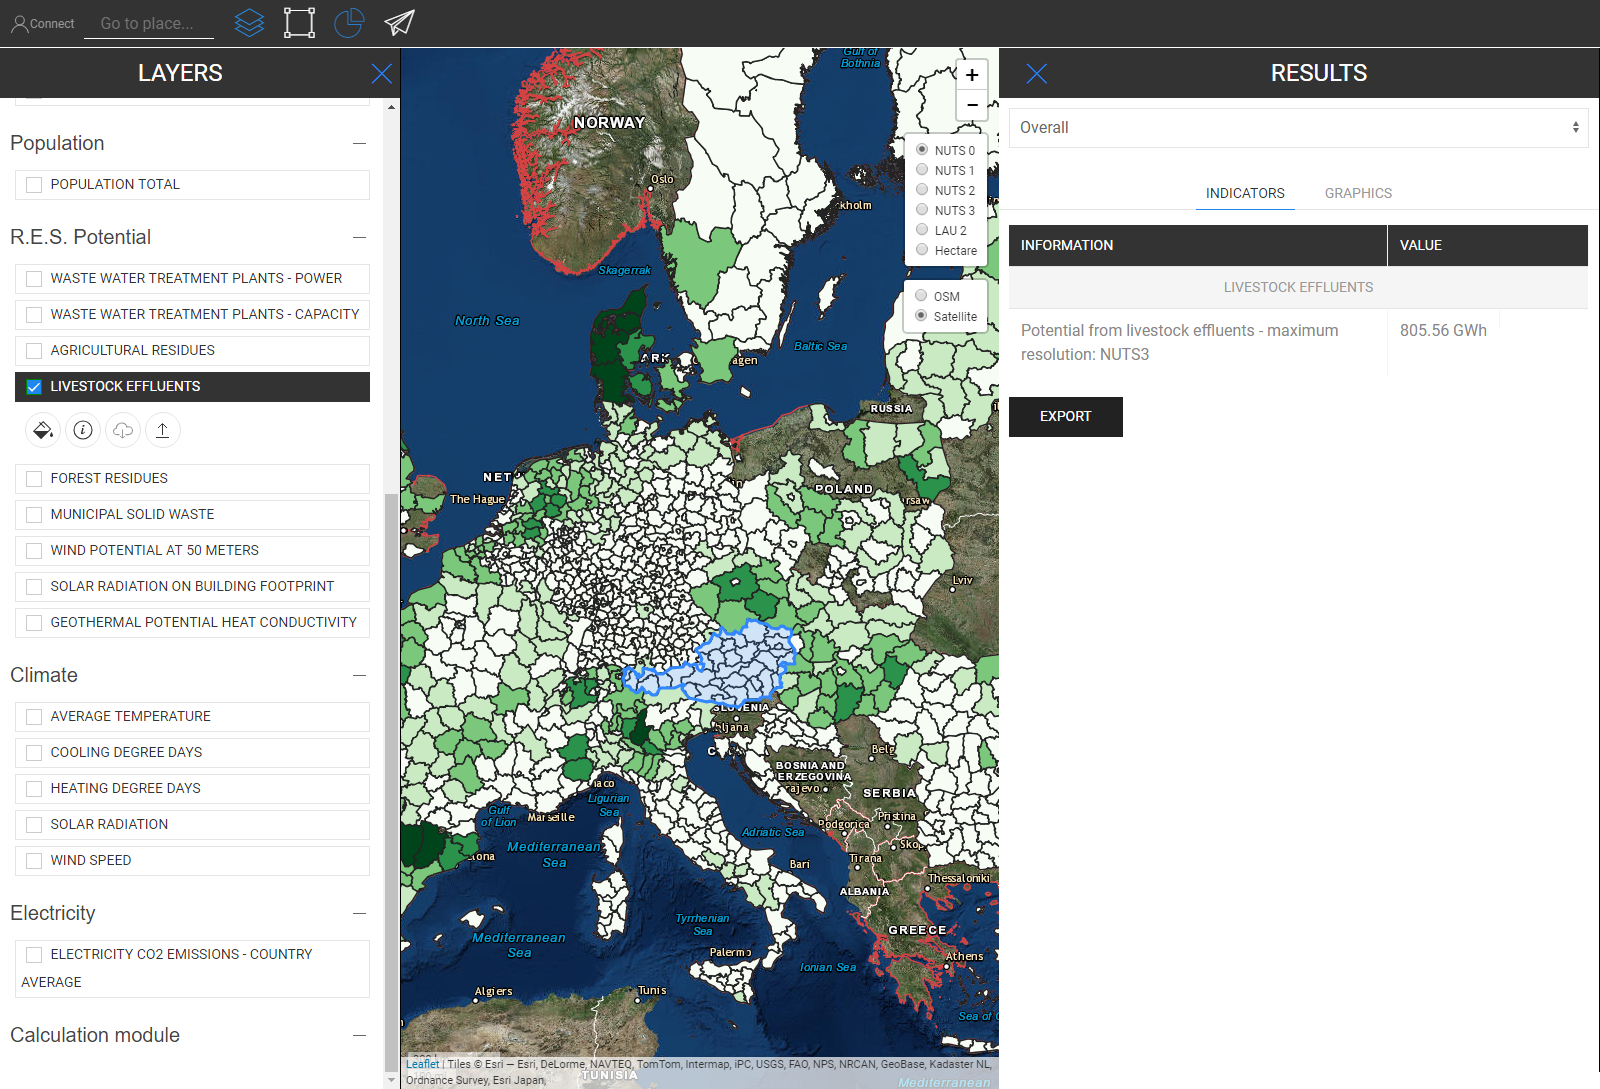
Livestock Effluents
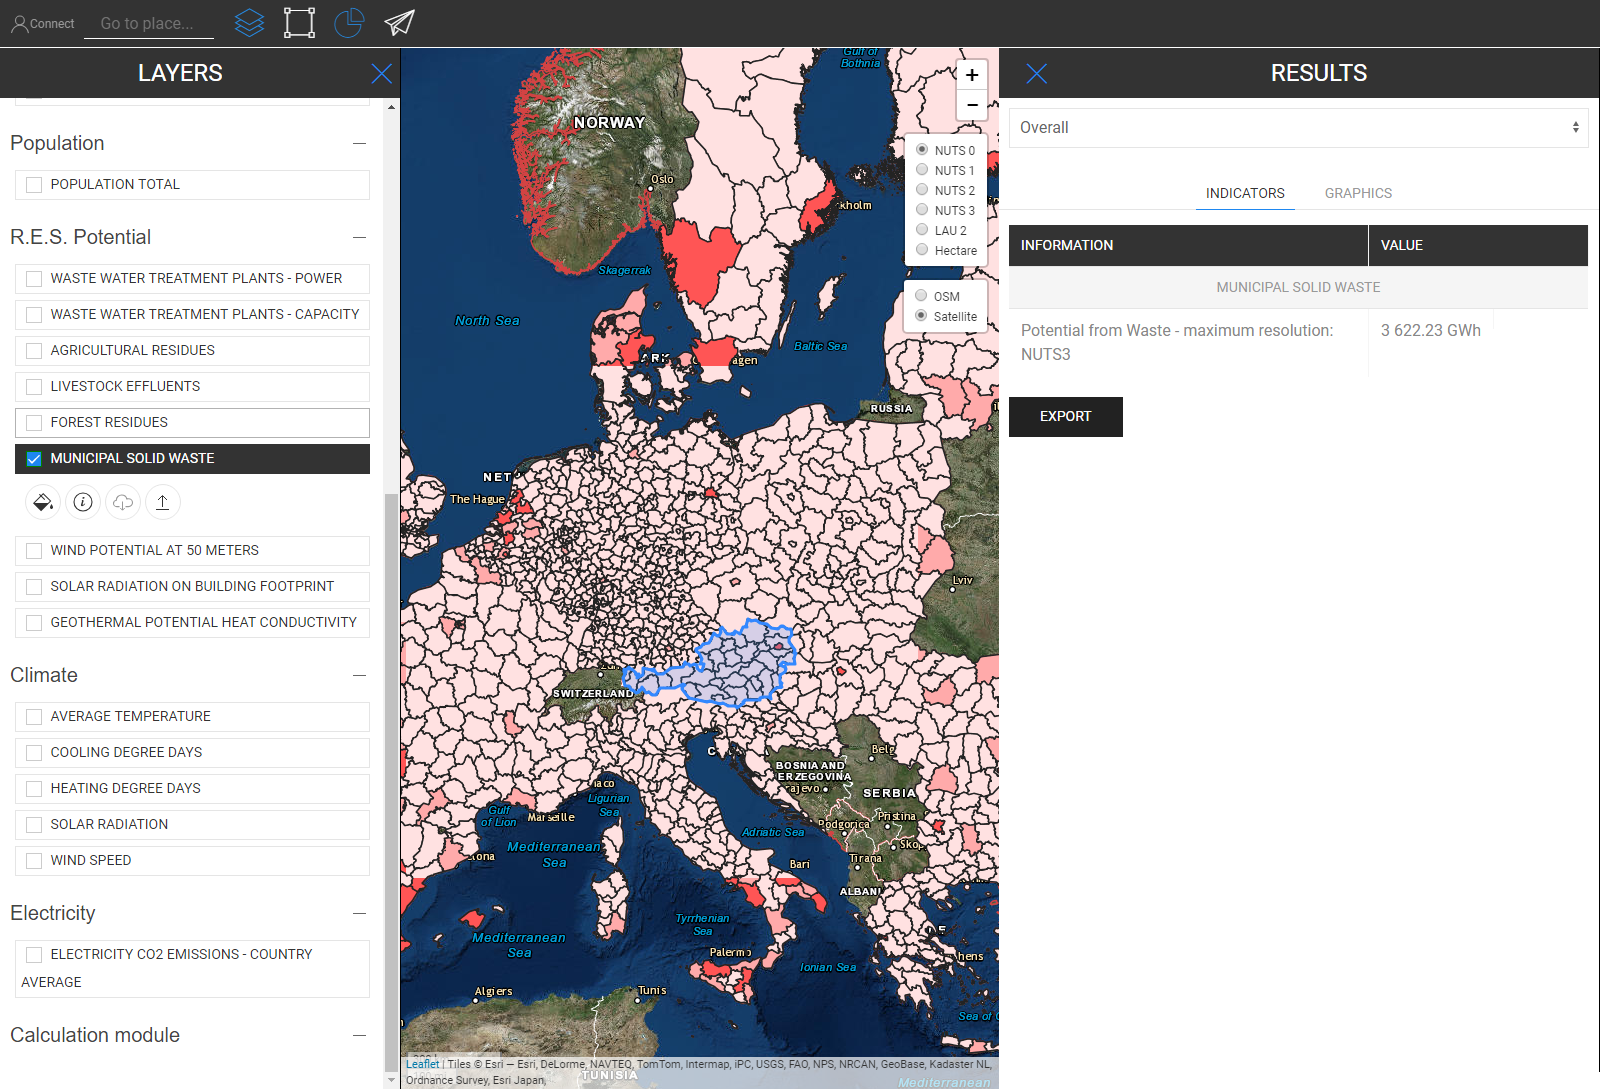
Municipal Solid Waste
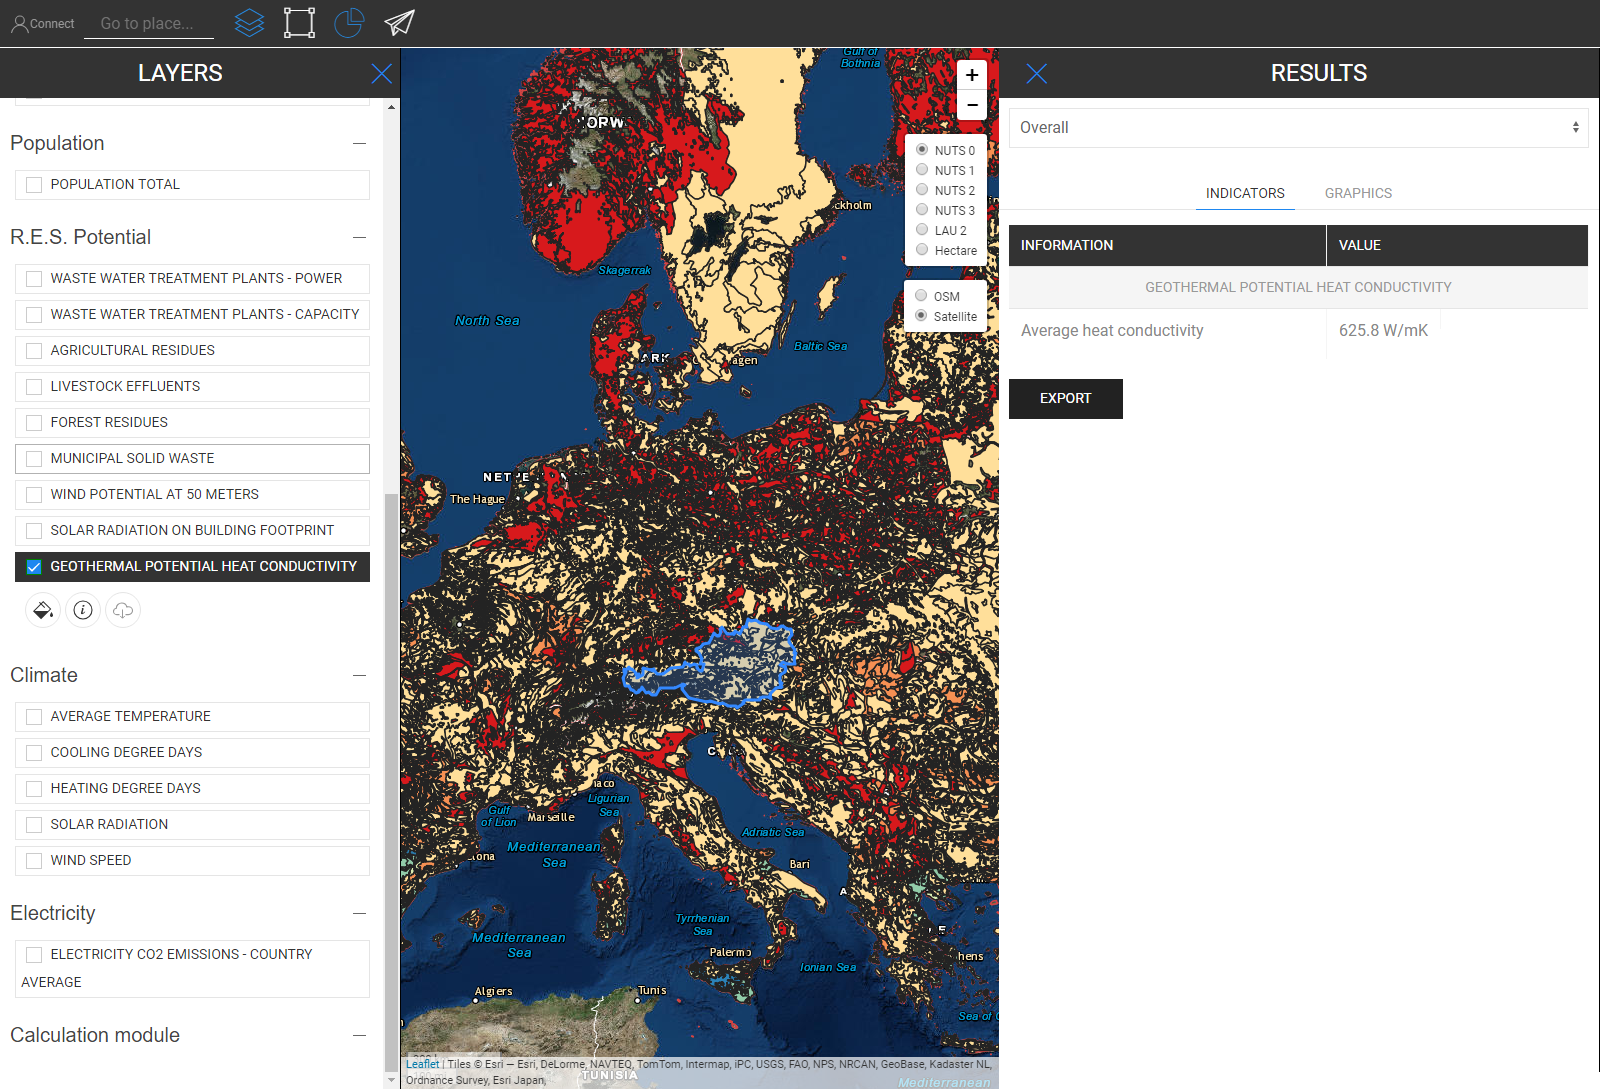
Geothermal Potential Heat Conductivity
Electricity C02 Emissions
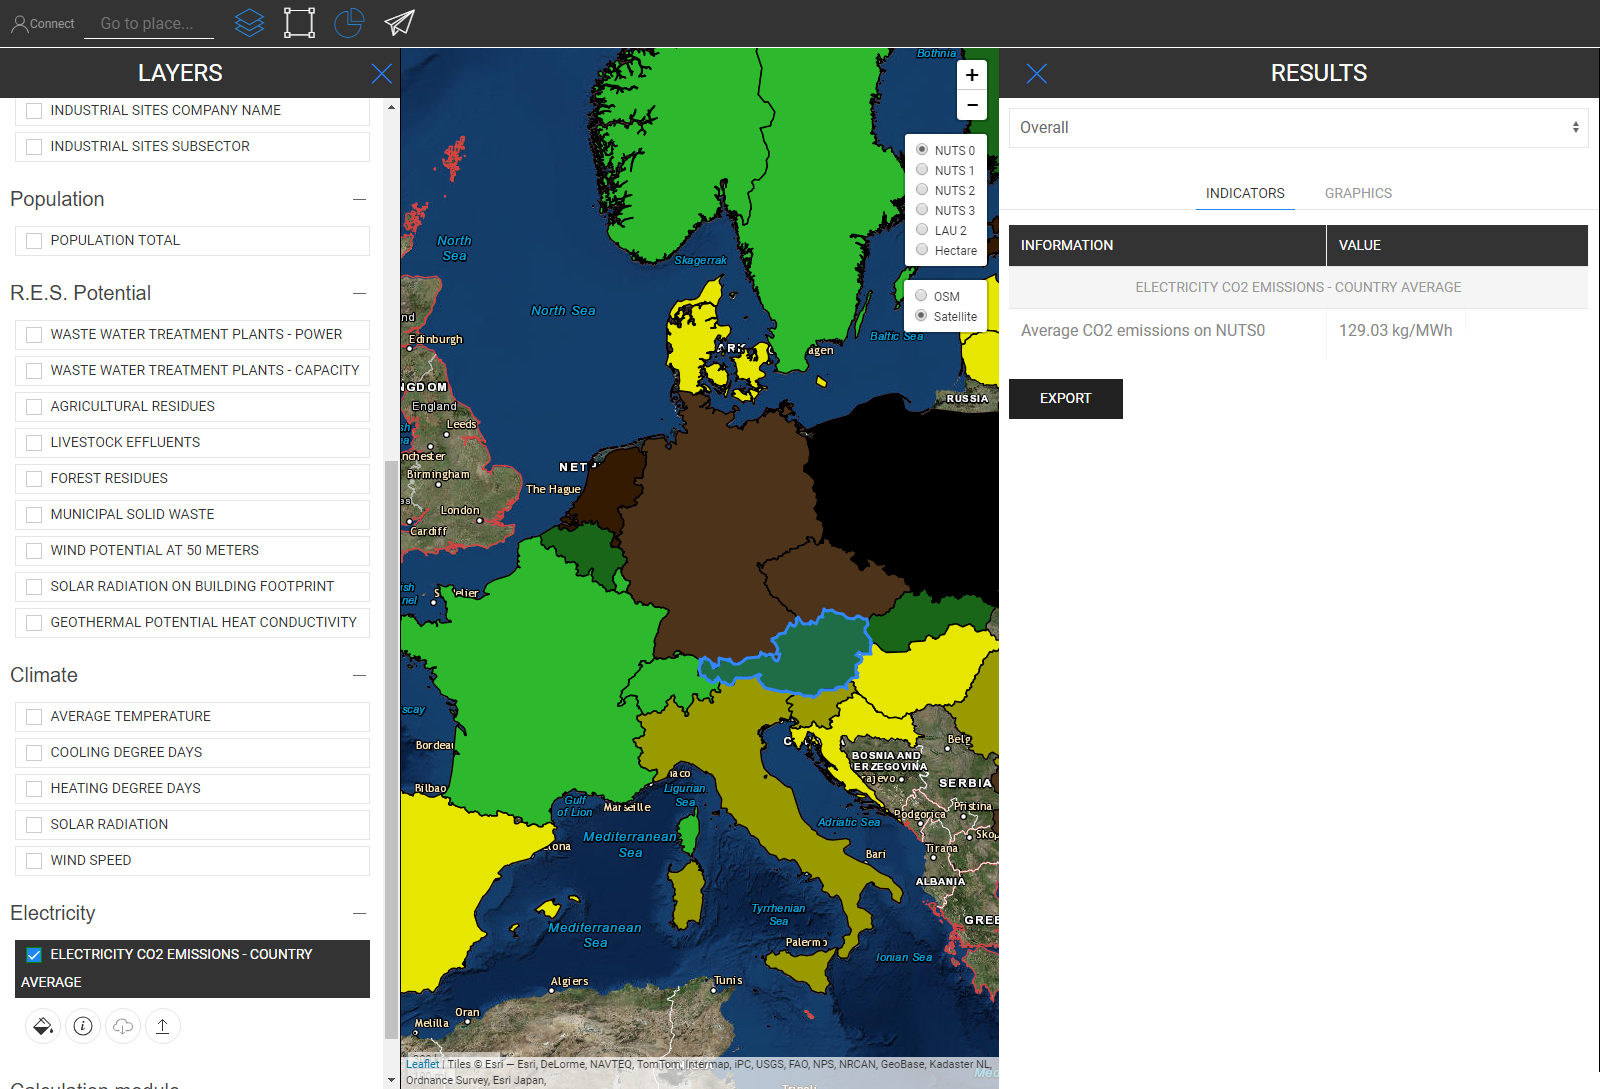
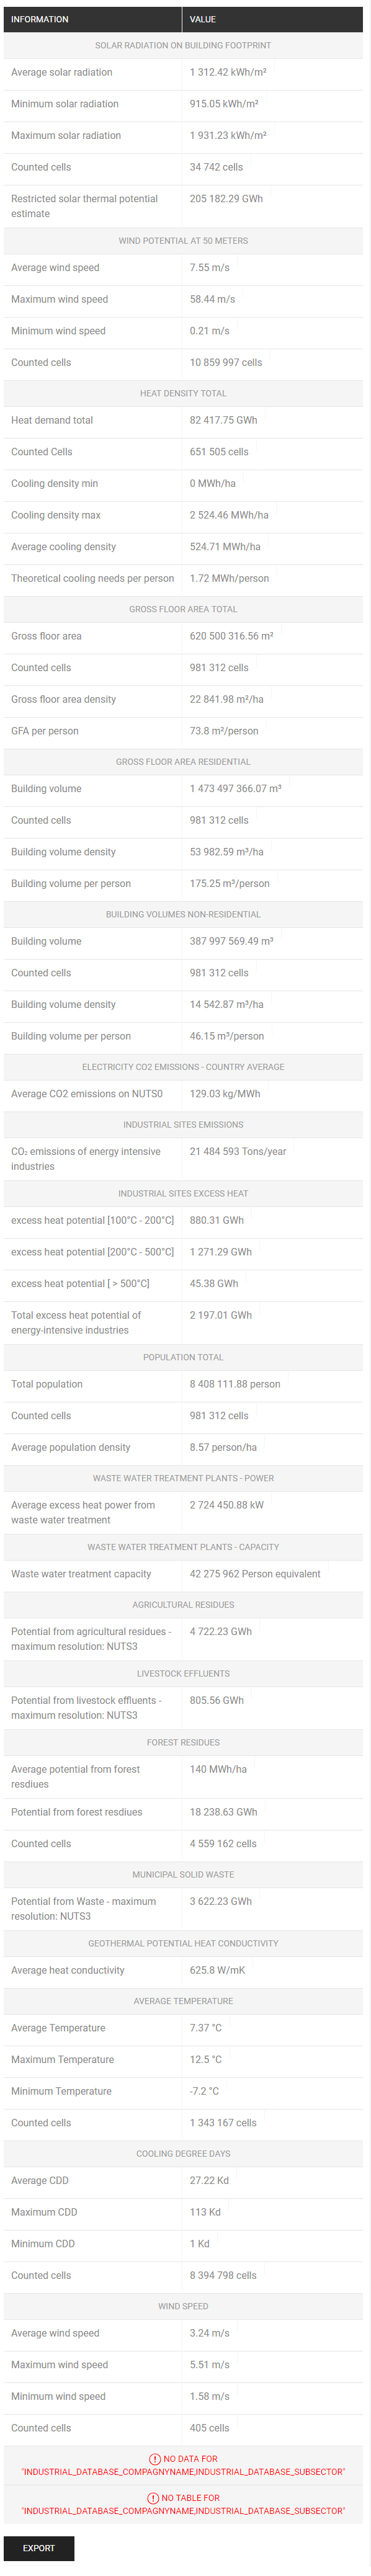
In the picture below you can see how it looks when all layers are visualized (here is Austria as NUTS0 selected)

Although this map can look a bit confusing at first sight, its indicators are straight forward illustrated. See below all indicators that are described in the result sidebar when you select all layers for Austria (NUTS0)
Jeton Hasani, in Hotmaps-Wiki, Retrieve-indicators-of-a-selected-area (April 2019)
This page was written by Jeton Hasani EEG - TU Wien.
☑ This page was reviewed by Mostafa Fallahnejad EEG - TU Wien.
Copyright © 2016-2020: Jeton Hasani
Creative Commons Attribution 4.0 International License
This work is licensed under a Creative Commons CC BY 4.0 International License.
SPDX-License-Identifier: CC-BY-4.0
License-Text: https://spdx.org/licenses/CC-BY-4.0.html
We would like to convey our deepest appreciation to the Horizon 2020 Hotmaps Project (Grant Agreement number 723677), which provided the funding to carry out the present investigation.
View in another language:
Bulgarian* Czech* Danish* German* Greek* Spanish* Estonian* Finnish* French* Irish* Croatian* Hungarian* Italian* Lithuanian* Latvian* Maltese* Dutch* Polish* Portuguese (Portugal, Brazil)* Romanian* Slovak* Slovenian* Swedish*
* machine translated