

not logged in | [Login]
![]()
This module allows comparing different heating scenarios. The module is not integrated into the Hotmaps Toolbox, but it is provided as a separate Excel workbook that combines the results of other calculation modules to be previously run. The template as it is allows comparing up to 9 different scenarios, but if properly adapted, it can work for any number of scenarios. Separate worksheets are set up to collate the key indicators from each calculation module, while key indicators are automatically collated in the final table and represented in graphs.
SCENARIO ASSESSMENT WORKBOOK: CLICK HERE TO DOWNLOAD
The approach to assessing a number of different heating scenarios follows this sequence of calculations:
In each scenario, a certain portion of heating is assumed to be provided through decentral heating and another through district heating. For instance, a sensitivity analysis for a set of different district heating systems, with different penetration levels and different centralised heating supply technologies that may vary by the capacity of the energy generators could be built upon one common business case of decentral heating with certain fixed supply options. Viceversa, other sensitivity assessments could be run with one centralised heat supply scenario, investigating the impact of the different decentralised technologies, or with any other combination of scenarios.
The user runs independently all the calculations modules for each scenario under consideration, reports the results in the relevant sheet of Excel Workbook, and then compares them.
The inputs compiled in the scenario assessment Workbook are produced by the following calculation modules:
1. CM - Decentral heating supply
2. CM - District heating supply dispatch
3. CM - District heating potential: economic assessment
The input and output of these modules should be saved for each scenario and then compiled in the scenario assessment workbook. The cells to be filled are properly marked and a color-coding legend is reported on the first sheet of the workbook, as explained in the following paragraph Interpretation of input parameters. The three above-mentioned calculation modules, require some inputs that you may already have, or that you may have to calculate running other modules, as specified in the following paragraph as well as in the Training section.
The sheet "Final Tabel" calculates and shows a comparison of these indicators both in the figures and charts for each scenario:
For each scenario, the following indicators are shown in the form of stacked bar chart:
The input parameters needed to run this module are divided into:
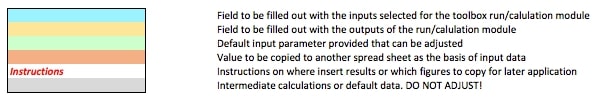
On top of these, the workbook has instructions in red text and additional calculations that should not be edited in grey cells. The picture below shows how the color-coding indicated on the front sheet of the workbook looks like.
This sheet mainly shows the overall output parameters both in figures and charts, and it has few input parameters.
A Scenarios Table (R4:Z17) is ready to be filled with a short description of the different scenarios object of the assessment. Placed right above the charts, this table can be a reminder for the user or clarification for other collaborators.
Further down in the sheet there are some parameters that have already been filled out, but can be adjusted, as long as they are not left empty:
This set of three tabs is used to build the building stock that will be used as an input parameter to calculate the output of the decentral heating supply. Please visit the CM - Decentral heating supply page for a deeper understanding of how the building stock feeds into that module.
Single-family building stock The worksheet as it is offers to structure a building stock for single-family houses of two different types: each column is dedicated to a building type and the CM - Decentral heating supply should be run once per each type. However, the user can adapt the Workbook in order to combine any number of different building categories (e.g. per age, gross floor area, category, etc.).
Multi-family building stock The worksheet as it is offers to structure a building stock for multi-family houses of eight different types: each column is dedicated to a building type and the CM - Decentral heating supply should be run once per each type. However, the user can adapt the Workbook in order to combine any number of different building categories (e.g. per age, gross floor area, category, etc.).
Mostafa Fallahnejad, in Hotmaps-Wiki, CM-Scenario-assessment (June 2019)
This page is written by Mostafa Fallahnejad*.
* Energy Economics Group - TU Wien
Institute of Energy Systems and Electrical Drives
Gusshausstrasse 27-29/370
1040 Wien
Copyright © 2016-2019: Mostafa Fallahnejad
Creative Commons Attribution 4.0 International License
This work is licensed under a Creative Commons CC BY 4.0 International License.
SPDX-License-Identifier: CC-BY-4.0
License-Text: https://spdx.org/licenses/CC-BY-4.0.html
We would like to convey our deepest appreciation to the Horizon 2020 Hotmaps Project (Grant Agreement number 723677), which provided the funding to carry out the present investigation.
View in another language:
* machine translated