

not logged in | [Login]
![]()
This module generates load profiles of demand for space heating and hot water generation for a selected region. It uses default load profiles for the residential and tertiary sector on NUTS2 level and scales it to a given demand in those sectors and provides the load profiles separated for space heating and hot water generation.
Hotmaps provides generic and year specific heat load profiles on NUTS2 level. The user may wish to adapt the default profiles based on the information that he/she has. This calculation module give the possibility for scaling different constituting elements of the profiles up or down and obtain a new profile.
Several layers and profiles are used from the default data set of the Hotmaps:
User should provide the following parameters:
The x-axis represents the time and the y-axis shows the power in MW. It can be helpful to hide certain sectors to better see others. This can be done by double-clicking on the legend.
Corresponding load profiles are assigned to industrial sites, residential and tertiary buildings in the user selection.
Based on the gross floor area of residential buildings and their NUTS 0 ID, the energy used for warm water supply is computed with the following list. Using the NUTS 2 ID of the selected area, a load profile is assigned. The residential hot water supply is multiplied by the residential hot water supply factor in case the user wants to adjust the value.
Specific energy per area for warm water supply in residential buildings in different countries
| Nuts0 ID | Warm water supply in kWh/m²/a |
|---|---|
| AT | 21.67 |
| BE | 31.95 |
| BG | 12.93 |
| HR | 21.38 |
| CY | 8.80 |
| CZ | 22.83 |
| DK | 9.64 |
| EE | 14.35 |
| FI | 10.15 |
| FR | 9.66 |
| DE | 8.27 |
| EL | 12.51 |
| HU | 13.66 |
| IE | 15.91 |
| IT | 14.01 |
| LV | 15.71 |
| LT | 13.36 |
| LU | 8.29 |
| MT | 10.99 |
| NL | 8.91 |
| PL | 10.00 |
| PT | 9.48 |
| RO | 11.48 |
| SK | 21.51 |
| SI | 21.74 |
| ES | 23.34 |
| SE | 13.54 |
| UK | 49.03 |
The heat demand density for the residential sector is used. Since this data set already contains the energy used for warm water, the previous computed warm water energy is subtracted from it. Based on the NUTS 2 ID a residential heating profile is assigned for each tile of the heat density in the user selection. The residential heating is multiplied by the residential heating factor in case the user wants to adjust the value.
Similar to the residential warm water supply the energy needed is computed with a table. With the NUTS 2 ID of a specific area, a load profile is assigned. The tertiary warm water supply is multiplied with the tertiary hot water supply factor in case the user wants to adjust the value.
Specific energy per area for warm water supply in tertiary buildings in different countries
| Nuts0 ID | Warm water supply in kWh/m²/a |
|---|---|
| AT | 6.57 |
| BE | 13.88 |
| BG | 15.88 |
| HR | 9.42 |
| CY | 6.26 |
| CZ | 9.18 |
| DK | 8.03 |
| EE | 14.13 |
| FI | 10.52 |
| FR | 9.57 |
| DE | 3.05 |
| EL | 6.99 |
| HU | 9.51 |
| IE | 10.87 |
| IT | 5.62 |
| LV | 7.16 |
| LT | 10.46 |
| LU | 7.20 |
| MT | 10.45 |
| NL | 6.89 |
| PL | 9.55 |
| PT | 21.47 |
| RO | 13.85 |
| SK | 8.49 |
| SI | 27.73 |
| ES | 12.44 |
| SE | 19.62 |
| UK | 13.45 |
The tertiary heating is computed similar to the residential heating. The tertiary heating is multiplied by the tertiary heating factor in case the user wants to adjust the value.
The heat demand by industry is looked up the industrial database and based on the NUTS 0 ID and the sub-sector a load profile is assigned.
The five resulting profiles are aggregated in an absolute way to obtain the final profile.
The mentioned load profiles consist of 8760 points which represent the load for every hour of the 365 days. Further information about the load profiles can be found here. All load profiles are normalized so that the integral is equal to 1.
The heat sources are taken from the industrial database. Based on their excess heat, NUTS 0 ID and industrial sector a load profile covering every hour of the year is created for each site.
The heat demand density of the residential and non-residential sectors are raster files that can be found here.
The gross floor area residential and gross floor area non-residential are raster files which can be found here and here.
Here you get the bleeding-edge development for this calculation module.
Sample run in DK05.
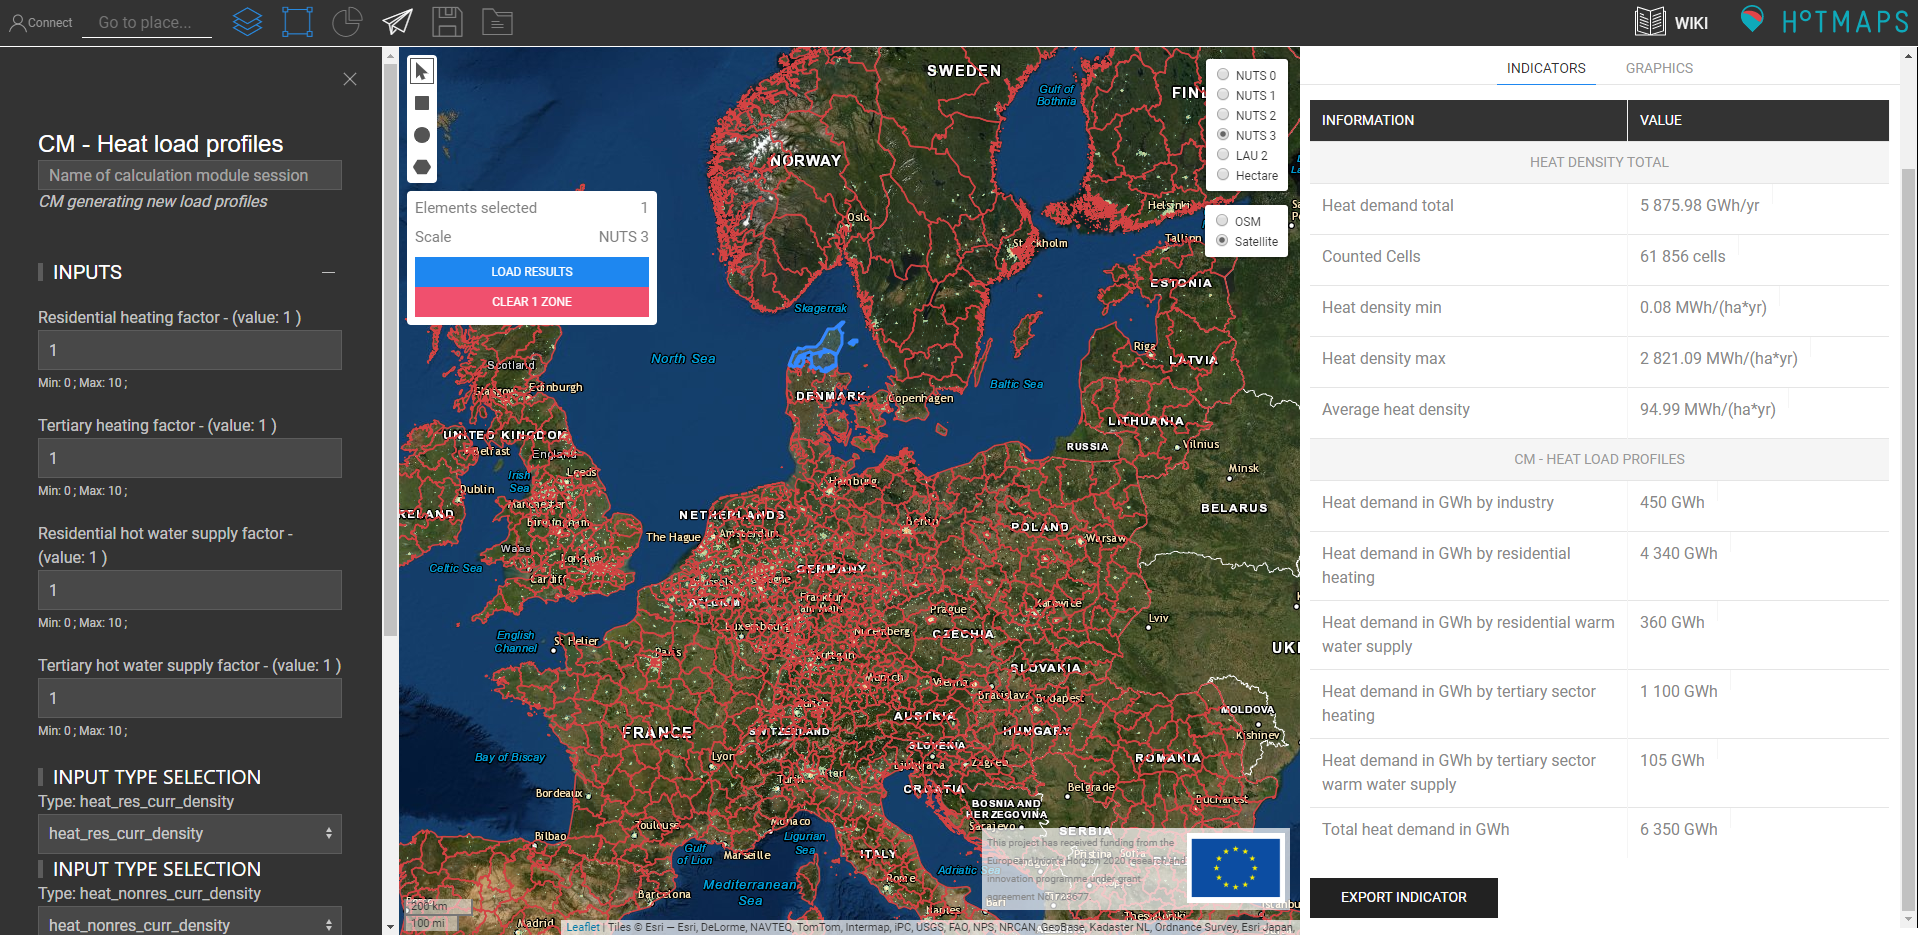 Sample run in DK05. Only the selected blue area is considered.
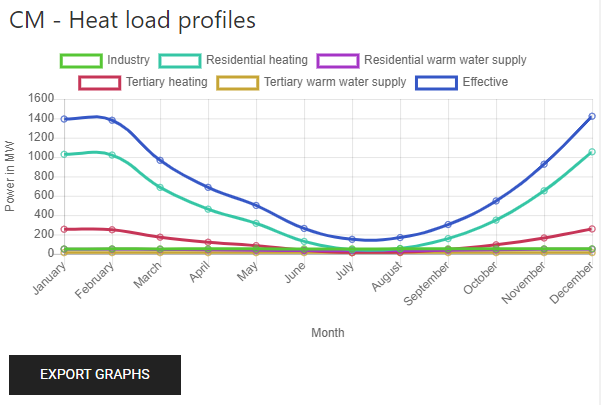 Graphic showing the heat demand of the different sectors over the year.
Data from this graphic can be exported by pressing the "EXPORT GRAPHS" button.
Ali Aydemir and David Schilling, in Hotmaps Wiki, CM Heat load profiles (September 2020)
This page was written by Ali Aydemir and David Schilling (Fraunhofer ISI).
☑ This page was reviewed by Tobias Fleiter (Fraunhofer ISI).
Copyright © 2016-2020: Ali Aydemir and David Schilling
Creative Commons Attribution 4.0 International License
This work is licensed under a Creative Commons CC BY 4.0 International License.
SPDX-License-Identifier: CC-BY-4.0
License-Text: https://spdx.org/licenses/CC-BY-4.0.html
We would like to convey our deepest appreciation to the Horizon 2020 Hotmaps Project (Grant Agreement number 723677), which provided the funding to carry out the present investigation.
View in another language:
Bulgarian* Czech* Danish* German* Greek* Spanish* Estonian* Finnish* French* Irish* Croatian* Hungarian* Italian* Lithuanian* Latvian* Maltese* Dutch* Polish* Portuguese (Portugal, Brazil)* Romanian* Slovak* Slovenian* Swedish*
* machine translated