

not logged in | [Login]
![]()
This module provides the possibility to add additional industry sites with their heating and cooling demand and excess heat potential to the Hotmaps toolbox. It is possible to add additional energy-intensive as well as less-energy intensive industries. The user enters the necessary data in a stand-alone Excel-tool, which then generates a CSV file for uploading to the Hotmaps toolbox.
🔺 Note: For the generation of the (.csv) files in the correct format, it is necessary that the default delimiter is set as comma (English standard). This cannot be configured from Excel and needs to be done globally from the Windows Control Panel (as described here). The figure below shows the exemplary setting for German windows PC's.

🔺 Note: For the proper use of the Excel-based tool, you must use point as decimal separator (English standard, e.g. 40.50). This need to be configured from Excel (as described here). The figure below shows the exemplary setting for German Excel.

Please download the provided Excel-tool from HERE.
The approach on how to use the Excel-tool is illustrated in the figure below and described in more detail in the following sections.

Please go to tabsheet: 
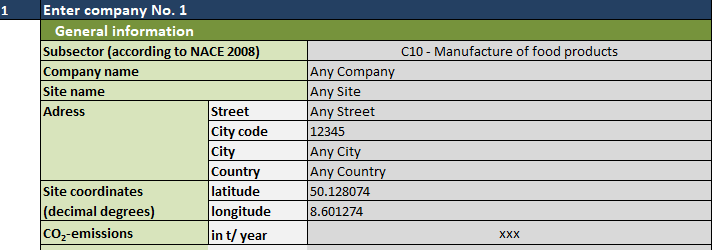
In the first step, please enter all necessary general information about the sites for which heating and cooling demand and excess heat potential should be calculated. It is possible to add up to 10 industrial sites.
In the second step, there are 3 options on how heating and cooling demand and excess heat potential can be estimated. Please note, that it is possible to switch between the three options for the different companies; but not within a company itself.
With regard to the excess heat temperature, it has to be mentioned, that low temperature heat (< 100°C) can be entered into the Excel-Tool, but is not yet evaluated in the Hotmaps toolbox. If low temperature heat should be considered, the application of a heat pump is necessary. Therefore, the user can include the electricity demand of a heat pump in the final energy demand for electricity and lift the temperature of the generated excess heat up to the range of 100-200°C.
Please go to tabsheet: 
Please choose this option, if data on heating / cooling demand and excess heat potential and temperature distribution is available for the selected company and can be filled in manually.
Please go to the tabsheet: 
Please choose this option, if no information about heating / cooling demand and excess heat potential is available for the selected company. Based on the plant's specific database, the typical heating/cooling demand and excess heat potentials with temperature distribution can be selected for a number of plants and products/processes. As a necessary input for the conversion of the product specific data, a value as calculation basis needs to be entered (e.g. production, area etc.). For more information concerning the calculation method see Method.
Please go to tabsheet: 
Please choose this option, if your plant type is not available in option 2. On the basis of sector specific heat data, typical heating / cooling demand and excess heat potentials are calculated. As a necessary input, the fuel demand for heat supply (in GWh/ year) must be entered. For more information concerning the calculation method see Method.
There are 2 files (*.csv) that are be generated by Excel-based tool and can be uploaded to the user account in the Hotmaps toolbox.
Please go to tabsheet: 
Export the table as .csv by clicking on:

Please go to tabsheet: 
Export the table as .csv by clicking on:

To upload the two .csv files, open the upload platform by clicking on Account.

In a next step, select the two .csv files for uploading and choose the right upload category for each file.

You can now check out your uploaded files in the section Layers - Personal layer

If the heating / cooling demand and excess heat potential of a plant is not known, two indicator-based methods are offered to the user for the calculation of heat demand and excess heat potential.
It has to be mentioned that these values are only indicative approximate values for typical plants (option 2) or on a sector level (option 3) and do not replace a detailed analysis and measurement of heat demand and excess heat of a plant.
The plant specific heat data is taken from the Forecast database. For a large number of different energy-intensive and less energy-intensive plant types process heating / cooling demand and excess heat potential are derived from the specific final energy demand of fuels and electricity. It is important to note that due to the underlying database only process heat and process cooling is covered with this method; space heating and hot water is not included here. Depending on the plant type different inputs as basis for the calculation are provided (e.g. production volume in tonnes or area in m2 ).
For the calculation of the heating and cooling demand, it is necessary to assume conversion efficiencies from final energy to heat and cooling. Since most of the heat applications are steam-based, an efficiency of 90% is assumed. For cooling applications a temperature level weighted energy efficiency ratio (EER) is assumed:
| Temperature level | assumed EER (according to Forecast database) |
|---|---|
| < -30°C | 0.01 |
| -30°C - 0°C | 1.8 |
| 0°C - 15°C & > 15°C | 3.5 |
The whole database used for option 2 is available here: Option2 Database
Option 3 provides a broad based assessment of heat demand and excess heat for the sectors of the manufacturing industry (according to NACE Rev. 2 [1]).
For the calculation of the excess heat potential of the different sectors excess heat factors according to Brückner 2016 [2] are used (see table below). The excess heat factor is defined as waste heat generated per fuel consumption. In [2] the available data to determine the excess heat potential in the manufacturing industry originates from the emissions survey carried out every four years on state level in Germany. According to the Emission Declaration Ordinance (1. BImSchG) all operators of plants, which are subject to approval, have to submit a declaration of their emissions every four years. For the year 2008 data on company level consisting of exhaust gas volume flows and their temperature level are evaluated. Together with available information on the type and quantity of fuel consumption of the plants, the excess heat factor of a plant is calculated as:
Excess heat factor = Excess heat / fuel consumption
Finally, the excess heat factor is calculated not only at company level but also on sector level. For detailed information see [2].
The excess heat factors according to [2] include excess heat coming from process heat as well as space heat generation and hot water. This is due to the fact that only an exhaust gas volume flow leaving the plant is analyzed without separating the fuel consumption into space heating, hot water and process heat. Excess heat generated by electricity based applications is not included.
The distribution of the share of excess heat per temperature range is based on own assumptions.
| NACE Rev. 2 | Sector | excess heat factor |
|---|---|---|
| 10 | Manufacture of food products | 0.10 |
| 11 | Manufacture of beverages | 0.14 |
| 12 | Manufacture of tobacco products | 0.12 |
| 13 | Manufacture of textiles | 0.29 |
| 14 | Manufacture of wearing apparel | 0.06 |
| 15 | Manufacture of leather and related products | 0.20 |
| 16 | Manufacture of wood and of products of wood and cork, except furniture; manufacture of articles of straw and plaiting materials | 0.10 |
| 17 | Manufacture of paper and paper products | 0.09 |
| 18 | Printing and reproduction of recorded media | 0.03 |
| 20 | Manufacture of chemicals and chemical products | 0.09 |
| 21 | Manufacture of basic pharmaceutical products and pharmaceutical preparations | 0.08 |
| 22 | Manufacture of rubber and plastic products | 0.17 |
| 23 | Manufacture of other non-metallic mineral products | 0.15 |
| 24 | Manufacture of basic metals | 0.19 |
| 25 | Manufacture of fabricated metal products, except machinery and equipment | 0.19 |
| 26 | Manufacture of computer, electronic and optical products | 0.18 |
| 27 | Manufacture of electrical equipment | 0.31 |
| 28 | Manufacture of machinery and equipment n.e.c. | 0.16 |
| 29 | Manufacture of motor vehicles, trailers and semi-trailers | 0.12 |
| 30 | Manufacture of other transport equipment | 0.38 |
| 31 | Manufacture of furniture | 0.12 |
| 32 | Other manufacturing | 0.08 |
| 33 | Repair and installation of machinery and equipment | 0.05 |
Excess heat factors for the sectors of the manufacturing industry (according to [1])
The breakdown of the final energy demand for fuels into temperature ranges on a sector level is based on a German study (data basis for evaluation of energy efficiency measures [3]). For the calculation of the heat demand it is assumed that almost all fuel purchases are used for heat. Consistent with option 2 a conversion efficiency from final energy to heat of 90% is assumed for steam-based heat generation.
The whole database used for option 3 is available here: Option3 Database
Here you get the bleeding-edge development for this calculation module.
[1]. European Commission: NACE Rev. 2 . Statistical classification of economic activities in the European Community. Luxembourg, 2008. ISBN: 978-92-79-04741-1.
[2]. Brückner S.: Industrielle Abwärme in Deutschland. Dissertation Technische Universtität München, 2016.
[3]. Prognos AG, Fraunhofer ISI, TU München: Datenbasis zur Bewertung von Energieeffizienzmaßnahmen in der Zeitreihe 2005-2014. Im Auftrag des Umweltbundesamtes. Dessau, 2017. ISSN 1862-4359.
Ali Aydemir and Lisa Neusel, in Hotmaps-Wiki, en-CM-Add-industry-plant (September 2020)
This page was written by Ali Aydemir and Lisa Neusel (Fraunhofer ISI).
☑ This page was reviewed by Tobias Fleiter (Fraunhofer ISI).
Copyright © 2016-2020: Ali Aydemir and Lisa Neusel
Creative Commons Attribution 4.0 International License
This work is licensed under a Creative Commons CC BY 4.0 International License.
SPDX-License-Identifier: CC-BY-4.0
License-Text: https://spdx.org/licenses/CC-BY-4.0.html
We would like to convey our deepest appreciation to the Horizon 2020 Hotmaps Project (Grant Agreement number 723677), which provided the funding to carry out the present investigation.
View in another language:
Bulgarian* Czech* Danish* German* Greek* Spanish* Estonian* Finnish* French* Irish* Croatian* Hungarian* Italian* Lithuanian* Latvian* Maltese* Dutch* Polish* Portuguese (Portugal, Brazil)* Romanian* Slovak* Slovenian* Swedish*
* machine translated